Learning Outcomes
After this course learners will be able to:
- Describe how self-assessment scales relate to the WHO 2001 International Classification of Functioning, Disability and Health (ICF).
- Describe how self-report inventories can complement audiometric findings.
- Describe the practical elements that an HCP should consider when selecting self-report inventories.
- Describe the different domains that are covered by common self-assessment scales.
- Describe a self-report battery that would be appropriate for a typical audiology clinic.
Introduction
Historically, in the fitting of hearing aids, decisions regarding candidacy, the quality of the product, and the “goodness” of the fitting have been determined using relatively objective measures: the audiogram, the resulting Speech Intelligibility Index (SII), unaided word recognition scores in quiet and in background noise, and the accuracy of a fit to a prescriptive target. While all these, of course, usually are important, in this day of patient-centered care, we recognize there are several key times during the patient’s hearing aid journey, when it is important to supplement, or even replace some of these measures with patient report—effectively collected with validated self-assessment inventories. Today, these inventories are available for a host of factors impacting the fitting of hearing aids: candidacy, handicap, motivation, expectations, disability, benefit, and satisfaction, just to name a few.
Unfortunately, although easy-to-use self-assessment scales are readily available, surveys show that they are mostly ignored in many clinics. We suspect that in some cases, or most cases, this is not because the HCP does not find them useful, but simply because the clinical applications have not been presented. In Volume 9 of Research QuickTakes, we hope to remedy this, by reviewing the many scales that are available, and demonstrating how they can be used effectively.
9.1 A Little Background: What are Self-Assessment Scales and Why are They Meaningful?
The notion of using self-assessment scales for the assessment of hearing handicap, determining the patient’s needs, and evaluating treatment effectiveness is of course not a new concept. And, as would be expected, over the years this has been recommended in most all Best Practice statements related to the fitting of hearing aids. Here are a couple examples taken from the most recent (2021) hearing aid fitting standard from the Audiology Practice Standard Organization (APSO; see Mueller et al, 2021, for review):
#3. A needs assessment is conducted in determining candidacy and in making individualized amplification recommendations. A needs assessment includes audiologic, physical, communication, listening, self-assessment, and other pertinent factors affecting patient outcomes.
#14. Hearing aid outcome measures are conducted. These may include validated self-assessment or communication inventories and aided speech recognition assessment.
Disability vs. Impairment vs. Handicap
When working with the self-assessment scales associated with hearing loss, it’s common to encounter the words disability, impairment and handicap. While on the surface, they might seem similar, there are important differences, which convey different meanings. To promote the appropriate use of these terms, in 1980 the World Health Organization (WHO) provided a conceptual framework by enabling classification and hence description of these three dimensions of "disablement," which can be a consequence of disease, injury or a congenital condition.
There was a revision of the 1980 WHO framework in 2001, titled the International Classification of Functioning, Disability and Health, or simply ICF. Their goal was to introduce a universal language, a structure that is an empowerment model, replacing the original disablement model. The new model replaces the terminology of impairment, disability and handicap with more positive words that define bodily functions and structures, activities and participation.
We point out these ICF differences in detail shortly, but first, as we previously stated, many audiologic outcome measures relate to the older WHO definitions, and these terms also are still often used in medical reports, so we’ll first review the original WHO categories, even though technically, they have been “replaced.” The following are the definitions from the WHO International Classification of Impairment, Disability, and Handicap (1980):
- Impairment: Any loss or abnormality of psychological, physiological or anatomical structure or function.
- Disability: Any restriction or lack of ability to perform an activity in the manner or within the range considered normal for a human being.
- Handicap: The result when an individual with an impairment cannot fulfill a normal life role.
Here is an example, using hearing loss, which might assist in understanding the differences:
- Impairment: Robert is a 60-year-old 8th grade science teacher. All his life he has been an avid hunter, rarely uses hearing protection, and has developed a 40-60 dB bilateral hearing loss in the 2000-4000 Hz range, believed to be cochlear in origin, secondary to noise exposure.
- Disability: Because a considerable portion of Robert’s hearing loss affects the audibility of important speech sounds, he has trouble understanding speech, especially when it is soft, from a distance, or when background noise is present.
- Handicap: Robert’s difficulty understanding speech has caused problems in the classroom. He frequency must ask students to repeat, answers a question inappropriately, or doesn’t respond at all. This has led to unsatisfactory ratings from the students.
Importantly, it is very possible that if Robert were fitted with hearing aids (or some other listening device was implemented), there would be a marked improvement in his speech understanding in the classroom—he would still have the impairment and the disability, but he may no longer have the handicap. Based on these definitions, it’s important to understand that a handicap is not a characteristic of a person, but rather, a description of the relationship between the person and the environment—which takes us to the 2001 WHO revision.
2001 WHO revision. As we stated earlier, the 2001 revision was to introduce a model that centered on “empowerment” rather than “disablement.” The general concept is outlined in Figure 9-1.
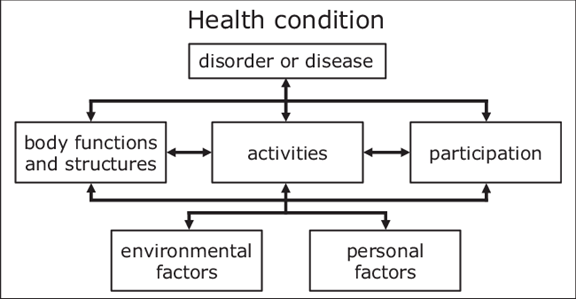
Figure 9-1. The biopsychosocial model of the International Classification of Functioning Disability and Health; ICF, WHO-2001.
Most notably, the two “labels” that have changed are:
- Disability: Is now “Activity Limitations”
- Handicap: Is now “Participation Restrictions.”
Going back to Robert, our hypothetical patient, his problems with the audibility of important speech sounds, trouble understanding speech, especially when in background noise would not be a disability, but rather an activity limitation. The problems that he is having in the classroom, would not be a handicap, but rather a participation restriction. The definition of the terms used in the model (see Figure 9-1) are summarized in Figure 9-2.
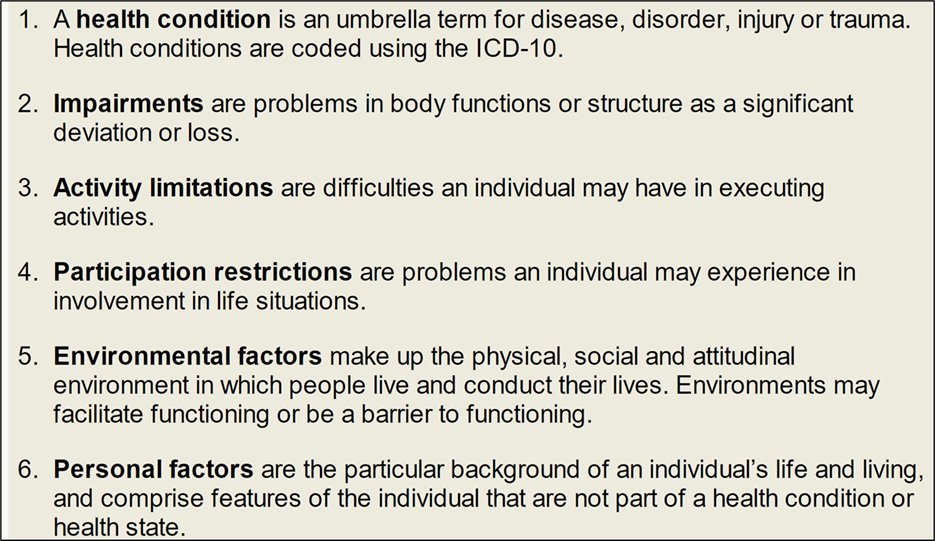
Figure 9-2. Explanation of terms used in the ICF model shown in Figure 9-1.
It’s certainly understandable why these revised terms are viewed as more patient-centered, and we see them in use more frequently each year. In the world of self-assessment inventories, however, we still refer to the APHAB as a disability-based scale. Similarly, only a few years ago, the HHIE and the HHIA were merged to form a new single scale (Cassarly, et al, 2020). The new scale was dubbed the Revised Hearing Handicap Inventory, not the Revised Hearing Participation Restriction Inventory.
Self-Assessment Inventories vs. Outcome Measures
Are outcome measures and self-assessment inventories the same thing? Often “yes,” but sometimes “no.” As the name suggests, a self-assessment inventory is completed by the patient and reflects their individual thoughts and beliefs regarding the given topic. Most self-assessment inventories could be used as an outcome measure, and some are specifically designed as such. For example, let’s take the Revised Hearing Handicap Inventory (RHHI; a scale replacing the HHIE and HHIA). This is a scale that measures the psychosocial handicap that might be caused by a hearing loss. Commonly, this is administered at the patient’s first clinic visit, to assist in counseling, and help determine amplification needs. However, this scale also can be used as an outcome measure—given again to the patient after several weeks of hearing aid use, to determine if the use of hearing aids has a positive impact. The Abbreviated Profile of Hearing Aid Benefit (APHAB) is another example of a self-assessment inventory that can be used both as a needs assessment, and to assess treatment effectiveness.
We need to consider, however, there are many other outcome measures that are not self-assessment scales. Probe-mic measures to assess appropriate audibility. The aided QuickSIN to determine if the desired improvement in speech-in-noise understanding was achieved. Aided LDLs, to ensure that the MPO was programmed correctly. And in research settings, we also have many different electroacoustic tools to study hearing aid benefit.
So yes, the most commonly used outcome measures in the clinic are self-assessment scales, which is what we’ll be discussing here, but there are many outcome measures that are not self-assessment scales.
Getting Started
To get us started, let’s walk through how self-assessment inventories might be used for a given patient:
- At the time of the initial patient visit, the RHHI is given to the patient (via mail, email or in the waiting room). Results are used to establish potential psychosocial handicap related to a hearing loss. The patient completes the APHAB, which helps determine the handicap for understanding in quiet, noise and reverberation. The patient is also given a one-question inventory (1-10 scaling), where they rate their degree of hearing impairment.
- Following the audiometric diagnostic evaluation, the patient is considered to be a candidate for bilateral hearing aids and is given the Expected Consequences of Hearing Aid Ownership (ECHO) scale, to determine if issues need to be discussed.
- At the time of the fitting, the patient identifies the 3-5 items of the Client Oriented Scale of Improvement (COSI), ranks the importance of each, and then rates the “expected” benefit for each item.
- A few weeks following the fitting, the patient returns and is given the aided RHHI, the aided APHAB, rates benefit for the COSI items (then compared to expectations), and, to assess satisfaction, the International Outcome Inventory for Hearing Aids (IOI-HA).
- On follow-up visits, the IOI-HA and RHHI are repeated to ensure stable benefit and satisfaction.
The example we just provided for a single patient included six different self-assessment scales. There are at least 6-10 other validated scales which could be substituted and probably would provide similar findings. There also, however, are 10 or more scales that focus on different domains, not directly addressed by our examples. In this volume of QuickTakes, we’ll try to provide a complete review of all options available.
Treatment Efficacy. Regarding the scales that are used as an outcome measure, it’s important to think of “treatment efficacy,” something reviewed nicely by Barbara Weinstein years ago (Weinstein, 1997). Treatment efficacy is tied to three different aspects of the selection and fitting process, all of which can be measured using self-assessment inventories:
- Treatment effectiveness: Do hearing aids provide appropriate audibility, improve speech intelligibility in quiet and for listening in background noise, and restore normal loudness perceptions?
- Treatment efficiency: Are certain hearing aids, or hearing aid settings/adjustments better than others for improving speech quality and understanding?
- Treatment effects: Does the use of hearing aids improve the patient’s social or emotional well-being, and the patient’s overall quality of life?
All three of these points must be considered when treatment efficacy is evaluated. It’s unlikely that a single outcome measure will address all the components of efficacy, and different assessment scales probably will be necessary. The main purpose of validation measures is to use this information for clinical decisions regarding patient care. In some cases, there also might be administrative reasons for maintaining and evaluating this information.
Administrative Reasons for Using Self-Assessment Inventories
While we normally think of self-assessment inventories as a tool to monitor the effectiveness of the fitting for a given patient, there also are some important management reasons why a dispensing office or clinic would want to routinely conduct these measures. Here are a few examples (adapted from Bentler et al, 2016):
- Comparison of different fitting procedures across groups of patients: You always fit your hearing aids to the NAL-NL2 targets with careful verification and adjustment using probe-mic measures. Your colleague, however, defers to the manufacturer’s first-fit proprietary setting. Will both groups of patients have the same benefit and satisfaction with hearing aids in the real world?
- Comparison of circuitry across groups of patients: A major hearing aid company just introduced a new product with AI-driven processing and deep neural networks. You’re pretty happy with the product from a different manufacturer that you’ve been dispensing. It’s important to know in your own setting if “new means better,” especially when the newer circuitry adds several hundred dollars to the cost of the hearing aids. If your patients were fitted with the new product, would they observe/report improved benefit and satisfaction? If yes, you might consider switching to that product.
- Counseling effectiveness across groups of patients: Does extra counseling effort result in improved real-world satisfaction and benefit with hearing aids? That is, if you have changed counseling techniques, or added time to the hearing aid fitting appointment, do the outcomes change for your patients? What if you added a week-end rehabilitative course for your patients? Improved satisfaction?
- Comparison of different dispensing sites or personnel: If you are the manager of a clinic that has several HCPs, and/or different offices, you might want to compare the patient-reported outcomes as a form of quality control. Does the satisfaction with hearing aids differ significantly between HCPs or offices?
- Documentation of service effectiveness: You know you do a good job, but do you have data to prove it? Are your patients more satisfied than the average person fitted with hearing aids? For example, how often do their IOI-HA scores exceed national norms? How often are their COSI goals obtained? How often are their aided APHAB scores equal to individuals with normal hearing? All information that may be meaningful for newly identified candidates.
- Survey effect. And finally, research has shown that patients are significantly more satisfied with their hearing aids when they have been given a formalized outcome measure asking them if they are satisfied with their hearing aids. That’s right, you can improve patient outcomes simply by measuring them!
Volume 9.2: Measuring the Hearing Impairment: Self-Assessment Findings vs. Conventional Audiometric Measures
As we discussed in the previous section, the starting point in the treatment model recommended by the WHO (2001) is the identification of the disorder or impairment. Since at least 1914, when the first commercially available electronic audiometer, the Western Electric 1A, became available, it has been common to identify “hearing loss” based on the patient’s pure-tone thresholds. While the scale has changed slightly over the years, and even today, not all agree on the cut-off value for “normal,” or exactly what frequencies should be included in the pure-tone average (PTA), observation of the dB values seems to be the gold standard. But what about the patients’ report regarding their “hearing loss?” Should we consider this redundant or complimentary information? Should these findings be viewed as equal, or even more important than pure-tone thresholds? Can this be used to determine hearing aid candidacy? We certainly do have validated self-assessment scales that could be used for this purpose.
This issue recently was discussed by audiologist Larry Humes (2022). He mentioned in his article that initially, when comparing self-assessment scores to pure-tone averages, whenever there was disagreement, he assumed it was the self-assessment score that was wrong. This is probably pretty common among audiologists. He further states, however, that he is starting to think differently, as is supported by the data in Figure 9-3; data that shows the scores for the HHIE from 1,619 adults (52.5% women), 50-90 years of age that completed the HHIE either at Indiana University (IU) or the Medical University of South Carolina (MUSC). These scores are plotted relative to the four-frequency average (500, 1000, 2000, 4000 Hz) of the best ear—recommended procedure from the WHO. Clearly, as shown in the Figure, a given amount of pure-tone hearing loss can correspond to a wide range of perceived hearing difficulties.
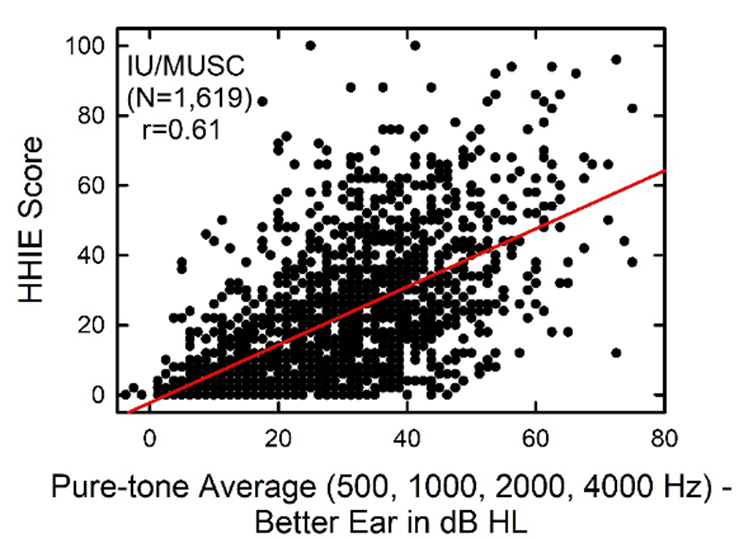
Figure 9-3. Relationship between the HHIE score and the pure-tone average for 500, 1000, 2000 and 4000 Hz for the better ear (Adapted from Humes 2022).
The correlation between these two measures is significant statistically, but the correlation value of r=0.61 means that the pure-tone average only explains about 1/3 of the variation. On average, individuals with a 40 dB PTA hearing loss will score 25-30 on the HHIE (equivalent to 10-14 on the HHIE-S). As shown in Figure 9-3, however, these individual scores can range from no difficulties (HHIE score= “0”) to extreme difficulties (HHIE score=“100"). Given that the HHIE has been with us for decades, there has been considerable research conducted comparing HHIE scores to the patient’s audiogram. Here are a few examples provided by Mueller et al (2014):
- Lichtenstein et al (1988) validated the HHIE-S against pure-tone audiometry for 178 patients over age 65 years old. They report that an HHIE-S score from 0 to 8 resulted in a likelihood ratio of 0.36, 13% probability of hearing loss (95% confidence interval, 0.19– to 0.68;), and a score of 26 or more yielded a likelihood ratio of 12.00, 84% probability of hearing loss (95% confidence interval, 2.62– to 55.00).
- Wiley et al (2000) used the HHIE-S in the study of 3,471 adults (1,963 women, 1,508 men), as part of a large epidemiological study of hearing disorders in older adults. Participants were divided into four groups based on age, which ranged from 48 to 92 years. Figure 9-4 illustrates the percent of significant hearing handicap (HHIE-S >8) as a function of the degree of hearing loss. The authors report that after accounting for the degree of audiometric hearing loss, self-reported hearing handicap actually was lower for older age groups. They suggest that the reasons for this might be that elderly individuals may minimize or ignore health problems, that the older population is simply less bothered by problems such as hearing loss, or they may simply accept hearing loss as a natural part of aging. Also, younger individuals are more active and place greater demands on their communication skills.
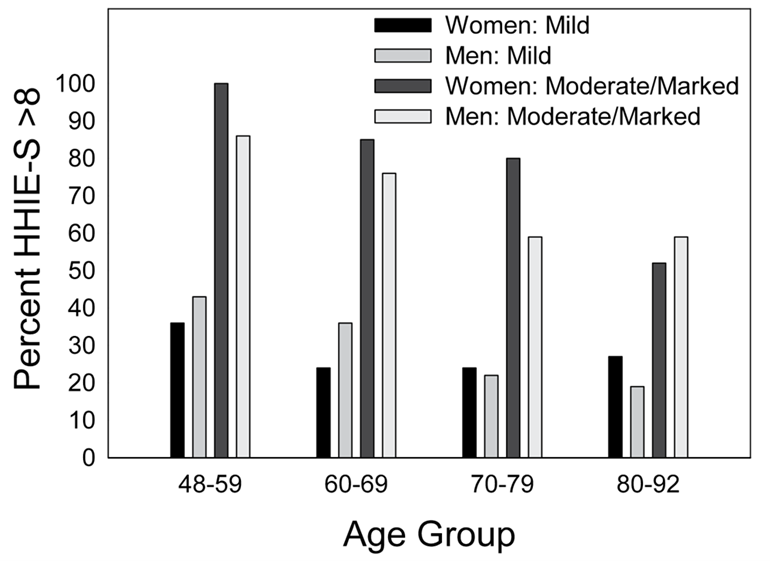
Figure 9-4. Illustration of the percentage of significant hearing handicap (HHIE-S >8) as a function of the degree of hearing loss, separated for men and women (Adapted from Wiley et al, 2000)
- Another large-scale study which utilized the HHIE was the Blue Mountains Hearing Study (BMHS), conducted in a representative older, Australian community during the years 1997–1999 (Sindhusake et al., 2001). The study included 1,817 individuals who had both audiometric threshold-testing and completed all questions on the HHIE-S (scores >8 were considered indicative of hearing handicap). Using the audiogram as the gold standard, a receiver operating characteristic (ROC) curves for HHIE-S score, for mild, moderate, and marked hearing impairment was computed. Based on this analysis, the authors acknowledge the usefulness of an HHIE-S score >8 in identifying moderate hearing loss but suggest that a lower HHIE-S cut-point score (e.g., >6) might be more useful in screening for mild hearing loss.
- The HHIE-S also was used in the Framingham Heart Study cohort. The gold standard used in this study was an audiogram showing a pure-tone threshold of 40 dB HL or higher at 1 and 2 kHz in one ear or at 1 or 2 kHz in both ears. Gates et al (2003) reported that the HHIE-S (cutoff score >8) had a sensitivity of 35% and a specificity of 94% for detecting the criterion hearing loss.
As we’ve mentioned, since all this early research, the HHIE/HHIA have merged, and we now have the RHHI (18-items), and a shorter 10-item screening version is available for clinical use (RHHI-S; Cassarly, et al, 2020). Based on their psychometric analysis, for the RHHI-S they have recommended a cut-off of =/> 6 to indicate a mild hearing impairment, slightly lower than that typically used in the past—see the ROC curves in Figure 9-5. As shown in the Figure, the =/>6 criterion detected hearing impairment with 70% sensitivity and 79% specificity. These values, of course, are easily influenced by the criterion used for defining audiometric hearing impairment. In this research, it was defined as the PTA of hearing thresholds at 500, 1000, 2000, and 4000 Hz >25 dB HL in the worse of the two ears.
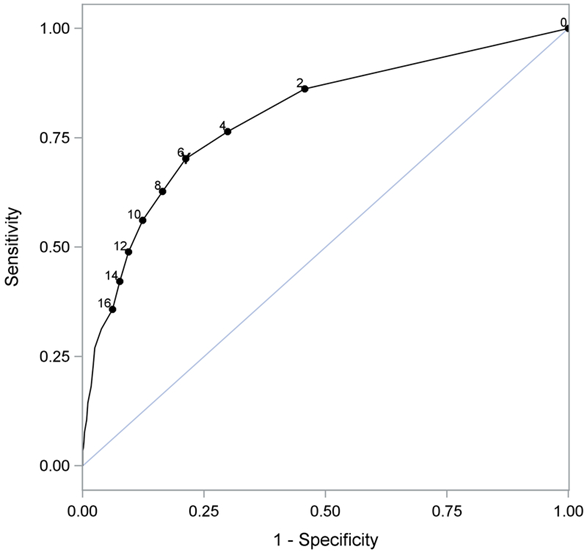
Figure 9-5. ROC curve for the RHHI-S. For this analysis, hearing loss was defined as a PTA >25 dB in the worse ear for the frequencies of 500, 1000, 2000, and 4000 Hz. Note that when the RHHI-S score =/>6 is used as the criterion for detecting hearing impairment it does so with 70% sensitivity and 79% specificity (from Cassarly, et al, 2020).
Self-Report Test Results and Hearing Aid Adoption
Given the significant correlations that have been shown between HHIE scores and degree of hearing loss, it’s reasonable to assume that the HHIE score also is correlated with the decision to use hearing aids. Going back almost 30 years, as part of MarkeTrak IV, Kochkin (1997) included the HHIE-S in a survey of 3,000 hearing aid owners and 3,500 hard of hearing non-owners (response rate approximately 80% for each group). The relationship between hearing aid ownership (percent adoption) and the HHIE-S score is shown in Figure 9-6. As illustrated, there is a systematic (and significant) relationship between the HHIE-S score and the decision to own hearing aids. Note, however, that even when HHIE scores are 30 or greater, approximately 50% of this group did not own hearing aids.
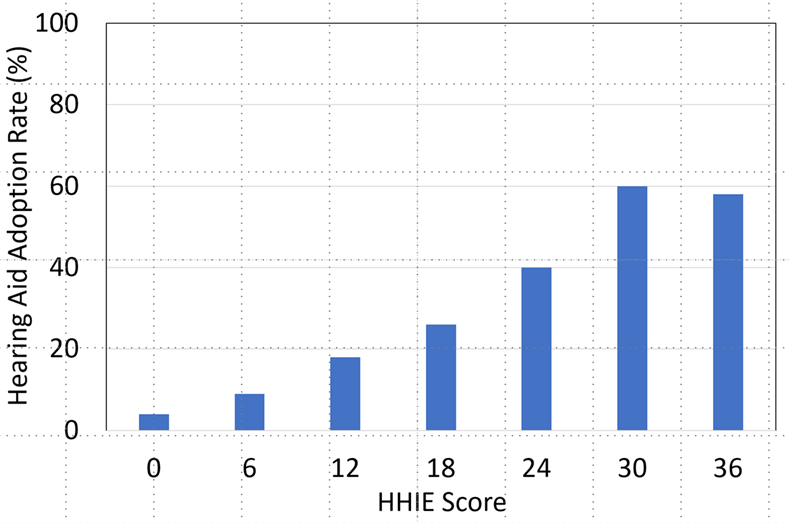
Figure 9-6. Hearing aid adoption rate (%) as a function of the HHIE-S score. (Adapted from Kochkin, 1997).
The HHIE/A also has been used in research to study the rate of hearing aid adoption. Simpson et al (2019) examined the time from hearing-aid candidacy to adoption in a 28-year ongoing prospective cohort of older adults, with the additional goal of determining factors influencing delays in hearing-aid adoption, and self-reported successful use of hearing aids. One of the tests that they administered was the 25-item HHIE/A. A total of 857 hearing aid candidates were identified, 125 of these already had hearing aids. Of the remaining 732, only 218 (30%) adopted hearing aids during the course of the study. Shown in Figure 9-7 is the adoption rate as a function of the social score on the HHIE/HHIA (Note: each HHIE/A question is classified as either “emotional” or “social,” with roughly a 50/50 split on all the versions of the scales. Results tend to be quite similar for the two different categories).
As shown in Figure 9-7, there was a significant relationship between the HHIE/S social score and the time of hearing aid adoption following candidacy identification. Observe that when the HHIE/S social score was </= to 10, the adoption rate was 11.1 years. The change was substantial, however, when the score was >16, when the adoption rate was 4.3 years. Certainly, these are findings that support the routine use of the RHHI. If we have our math correct, a score of >16 (which would be at the minimum, 18) on the 25-item version, would be a score of 8 for the five social questions on the screening version, the RHHI-S. This only would be two answers of “yes,” or four answers of “sometimes,” or some similar combination.
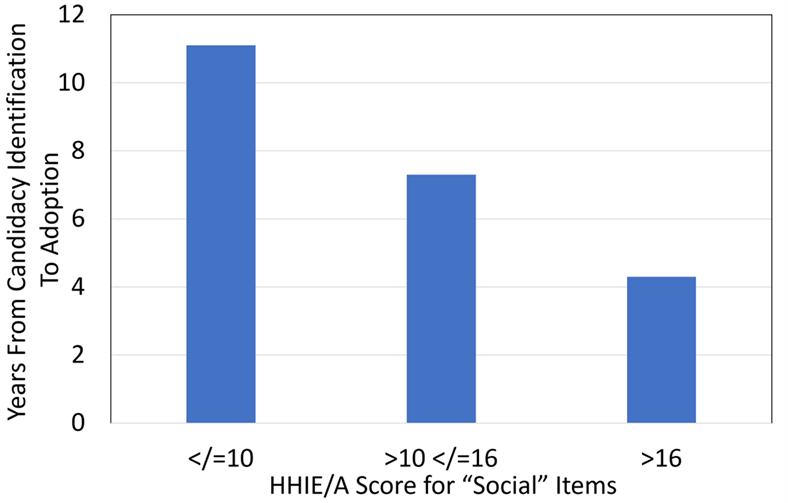
Figure 9-7. Display of the relationship between the time from identification as hearing aid candidate to adoption as a function of the patient’s HHIE/A Social score. (Adapted from Simpson et al, 2019).
As we’ve discussed in previous Research Quick Takes, Larry Humes has published extensively regarding the utility of the HHIE/HHIA. One study which relates to our current discussion compared each participant’s classification of degree of hearing loss, i.e., normal, mild, or moderate (based on the World Health Organization Hearing Impairment [WHO-HI] grade) to their self-reported unaided and aided scores on the HHIE. Hearing Handicap Inventory for the Elderly (HHIE). This comparison was conducted for a large group (n=194) who had been fitted bilaterally with hearing aids based on best practice (e.g., verified NAL-NL2 fitting). The results are displayed in Figure 9.8.
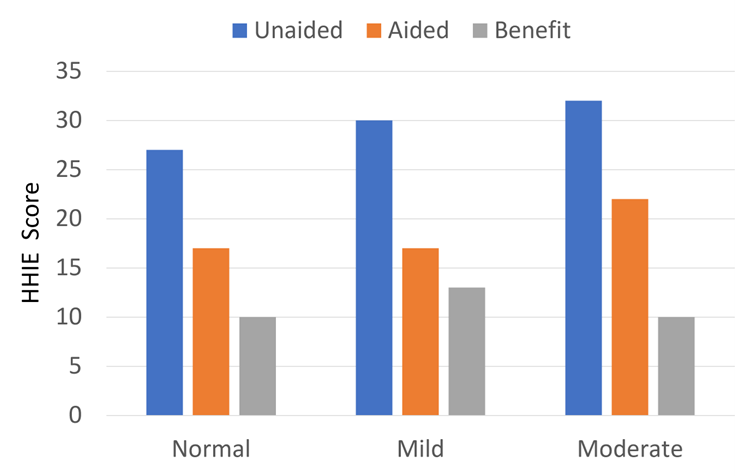
Figure 9.8. Shown are HHIE findings for three groups varying in their classification of degree of hearing loss (adapted from Humes, 2020).
As shown in Figure 9.8, as expected, there was a slight increase (more handicap) as the hearing loss became worse, but note that this was only a 5-point change (27 to 32; 5%) for the HHIE when going from “normal hearing” to moderate hearing loss (based on audiometric data). What also stands out, however, is that the benefit from hearing aid use based on the HHIE self-report was no greater for the individuals classified as having as “moderate” hearing loss by the WHO-HI, than those who were classified as “normal hearing.”
The relationship between hearing aid use and the HHIE/A also was examined in the Beaver Dam Offspring Study. The Beaver Dam Offspring Study (Weycker et al, 2021) was research to investigate hearing, vision, and olfaction in the children of the participants in the original Beaver Dam study. The purpose was to measure the 10-year incidence of hearing aid adoption in a sample of primarily middle-aged adults with high-frequency hearing loss, and identify factors associated with hearing aid adoption. This included 579 adults (ages 34–80 years) who all had a high-frequency pure-tone average >25 dB HL (3–8 kHz). Most participants (75%) were between the ages of 45 and 65 years. In addition to hearing threshold testing, word recognition measures in both quiet and in background noise, the HHIE/A-S was administered.
The number of individuals who adopted hearing aids within the 10-year period was only 69 (12%). Factors significantly associated with adoption using a multivariable model included: higher education, worse high-frequency pure-tone average, and self-reported hearing loss. Interesting, clinical word recognition measures in background noise were not significantly associated, perhaps because the hearing losses were relatively mild. Effects of age and sex also were not significant.
Hidden Hearing Loss
“Hidden” hearing loss is term that has been tossed around quite a bit in recent years, probably too carelessly in some instances. Regarding what it is . . . that answer probably will be different if you ask a hearing scientist vs. a clinician. We won’t get into cochlear synaptopathy, auditory processing, and all the other factors here. From a clinical standpoint, the term often is used simply to explain someone who states they have a hearing problem (usually understanding speech in background noise), but yet their hearing thresholds are "normal”—hence the loss is “hidden.” Now, if speech-in-noise testing was routinely conducted, we suspect that many of these patients would no longer have a problem that was “hidden.” Our topic in this Research Quick Takes, however, is self-report inventories, which are another way of addressing the issue. As we already have shown, patients can have “normal” hearing but still have abnormal findings on a self-report scale. How does this relate to hearing aid candidacy?
Roup et al (2018) examined the notion of fitting hearing aids to individuals with normal hearing, but who had an abnormal self-report score. All participants had hearing sensitivity <25 dB for 250-8000 Hz; the control group of 20 young adults (19–27 years of age), however, did not have any self-reported hearing difficulties. The experimental group included 17 adults (18–58 year old; mean age = 30.8), with HHIA scores >20.
A significant benefit was reported for hearing aid use based on the field trial—for the experimental group, HHIA scores went from a mean of 38.4 (unaided) to 20.5 (aided). Despite this significant average reported real-world benefit, at the conclusion of the study, when given the opportunity to purchase the experimental hearing aids at a reduced cost, only 3 of the 17 participants complied.
A similar study recently was published by Mealings et al (2024). The participants were 27 adults (17 females, 19–68 years old, mean ± SD = 42.7 ± 11.9 years). All participants reported hearing problems on a self-report inventory but had normal hearing: The mean ± SD (minimum–maximum) of the four-frequency average hearing loss was 8.3 ± 4.8 dB (0–16.3 dB) for the left ear and 9.8 ± 5.0 dB (1.3–21.3 dB) for the right ear.
This was a double-blinded case-control study where participants completed retrospective questionnaires, ecological momentary assessments (EMAs), speech-in-noise testing, and mental effort testing with and without hearing aids. A somewhat unique aspect of this study, compared to others of this type, is that the participants were randomly separated into two groups. The “experimental group” trialed mild-gain hearing aids with advanced directional processing. The “control group” also were fitted with hearing aids, but their aids were programmed to 0 dB insertion gain, with no directionality.
The results showed the following:
- Regarding the retrospective questionnaires, experimental participants reported significantly lower levels of hearing-in-noise difficulties when they were fitted with mild-gain hearing aids compared to no device. The placebo control group showed no difference.
- Experimental participants reported significantly higher satisfaction with the devices than those in the placebo control group.
- For the real-world EMA, the experimental group reported a significantly better hearing experience when they were aided compared with unaided. The placebo group did not.
- Neither group showed an aided advantage for the laboratory testing (speech-in-noise and listening effort).
Despite the real-world benefit reported by the participants (91% reported improved speech understanding in background noise), when given the option of buying the hearing aids for a purchase price of ~$3500, none of them agreed to this option. This is similar to the findings of Roup et al (2018) which we discussed earlier.
There is one additional study that used a different self-assessment we’d like to discuss. We include it here because it examined self-reported hearing difficulties in a population, younger veterans of the US military, who are considered at-risk for hearing-related disabilities. Additionally, this study is worthy of attention because it uses a relatively common self-assessment in tinnitus treatment clinics, the Tinnitus and Hearing Survey (THS), and applied it to the identification of hearing difficulties with just four questions.
Using the four hearing-related questions on the Tinnitus and Hearing Survey (THS-H), Sherlock et al (2024) asked 22,583 US Service Members complete the THS-H using an 11-point scale ranging from 0 (not a problem) to 10 (a very big problem). The average age of the participants was 30.7 years. The 4 questions on the THS-H they asked this group were:
- Over the last week, I couldn’t understand what others were saying in noisy or crowded places.
- Over the last week, I couldn’t understand what people were saying on TV or in movies.
- Over the last week, I couldn’t understand people with soft voices.
- Over the last week, I couldn’t understand what was being said in group conversations.
Responses to the four items were summed to produce values between 0 and 40. The distribution of the final scores was analyzed based on severity of hearing loss, age, and sex of the 22,583 respondents. Only 5% of respondents with clinically normal hearing scored above 27, so this score was selected as a cutoff for “clinically significant hearing problems.” Similar to the RHHI-S, the even-shorter THS-H could be used to identify preclinical changes in hearing that might identify individuals who are at risk for long-term hearing problems. Although this study was conducted with U.S. Veterans, we believe the THS-H could be a valuable tool for assessing subjective hearing difficulties in the general population, especially in practices that screen the hearing of large numbers of younger and middle-aged individuals.
In Closing
In general, we see that self-report of hearing problems is significantly associated with audiometric hearing loss, but there is a large amount of unexplained variance—some people with significant hearing loss report little or no problems, and some people with normal hearing report significant problems. It then falls on the clinician to use both sets of data to offer the most effective treatment plan.
Volume 9.3: Considerations of Utility, Reliability, and Validity.
As we’ve discussed to this point, regarding the selection and fitting of hearing aids, self-report inventories can be used to determine if there is impairment, as a needs assessment for treatment planning and as a validation measure of benefit, satisfaction and quality of life improvement. In the “old days” the self-report was not conducted with a researched scale of several critical items, but simply by having an informal discussion with the patient—hence, the popularity of the “how does that sound?” hearing aid validation procedure. While often quite useful, such informal assessments can be susceptible to several errors including (Ricketts et al, 2019):
- Biasing patients to provide an answer the clinician is looking for.
- Failing to ask the most important or salient questions.
- Using questions that are either unreliable or invalid (or both).
- Failing to record problems or commenting on the patient encounter in the patient report.
- Follow-up of important areas during post-fitting visits.
Fortunately, over the past few decades, several self-report inventories have been introduced. We must remember, however, that just because we have several written questions organized in an orderly manner, and we have a convenient Likert scale to use for each question, this doesn’t automatically mean that our findings will be valid and reliable.
Without question, in the past 35 years, the person who contributed the most to self-report inventories was audiologist Robyn Cox. With the help of her colleagues at the University of Memphis, several scales were developed, many of which are in common use today. Information on most if not all the scales can be found at the University of Memphis Hearing Aid Research Laboratory (https://harlmemphis.org/). As her colleagues will tell you, Robyn was very meticulous regarding the design and psychometric properties of all the scales she worked with. In a 2005 article, she shared some of her thoughts regarding the fundamental characteristics that we should consider when selecting a self-assessment inventory. The following section is adapted from her article, with some additions from Ricketts et al, 2019.
Cox (2005) suggests that there are four practical elements the audiologist should consider: clinical burden, patient burden, scoring, and utility. She states that these are factors that will impact on the everyday use and success of the inventory. We’ll discuss each one of these factors.
Clinician burden. This relates to the challenges for the audiologist in learning how to administer, score and interpret the test. Does learning about the test require a 1-day instructional course, reading several articles, or a 5-minute YouTube tutorial? If a given test is known as a “difficult” test to learn, this may prompt clinicians to avoid it before even trying it. Clinician burden also can be a factor related to scoring, which we’ll talk about later.
Examples: We’ve already talked quite a bit about the RHHI-S, so we’ll use that as an example of low clinician burden. Figure 9.9 is a sample completed form from a patient with a mild-to-moderate downward sloping hearing loss. Note that there only are 10 questions, all of which are easy for the patient to understand. “Learning the test” for the clinician is little more than doing a quick read of the instructions. In many clinics the inventory simply is handed to the patient to complete while sitting in the waiting room.
A popular self-report test that has a higher clinician burden is the Abbreviated Profile of Hearing Aid Benefit (APHAB). It’s 24 questions divided into four categories of 6 questions each. Each statement is rated on a 7-point scale going from A=Always (99%) to G=Never (1%). For a given patient, “A or B” might be the correct response for some statements, but “F” or “G” might be the appropriate response for others that have reversed wording. Patients often need help with this scale.
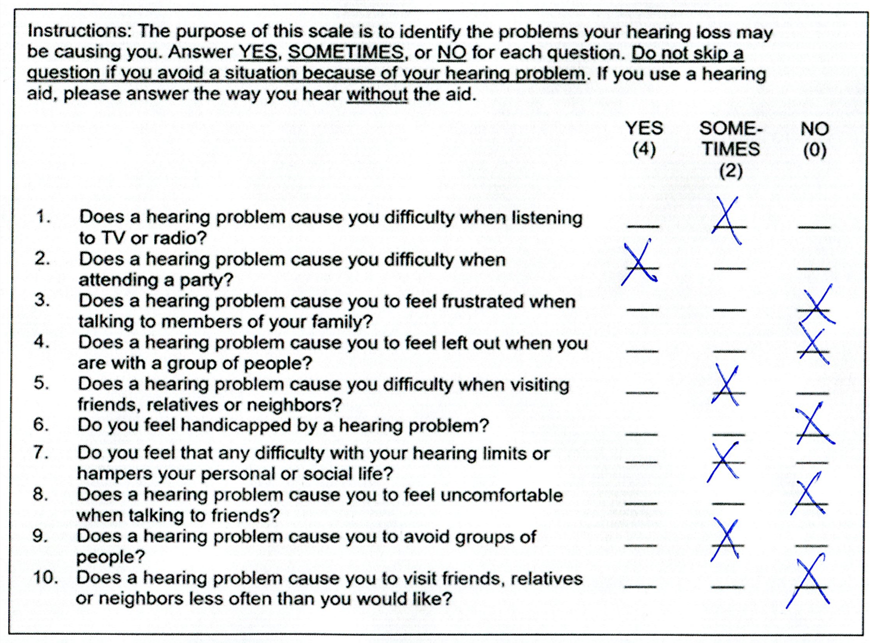
Figure 9.9. Example of completed RHHI (from Mueller, 2025).
Patient burden. This refers to the difficulty encountered by the patient in reading, understanding, and completing the items of the questionnaire. The reading level and cognitive level of both items and instructions should be considered. In general, the patient burden, high or low, is similar to the clinician burden. Patient burden is important when deciding if a scale can be mailed to the patient in advance, or if it needs to be completed knee-to-knee with the patient in the clinic. Also, some scales have been designed specifically for computer or internet administration, which might not be workable for some patients.
Scoring. Busy clinical audiologists are looking for a questionnaire that is convenient, quick, objective, and easy to score. Automated scoring usually is preferred but not always available. Computerized scoring can be accomplished through direct keyboard entry by the patient (e.g., using an iPad in your waiting room), although usually the audiologist keys in answers from a completed paper-pencil measure—with a little luck there are support staff to do this. The three inventories that are part of the HIMSA Noah Questionnaire Module are the APHAB, Client Oriented Scale of Improvement (COSI) and International Outcome Inventory for Hearing Aids (IOI-HA). Cox (2005) states that computer-based scoring has at least three advantages: (1) the scores are obtained quickly and accurately; (2) comparison with norms, previous sessions, and so on can be accomplished readily; and (3) a database of patient records can be built up without additional effort or time.
Example: Going back to our RHHI example in Figure 9.9, it doesn’t get much easier to score than this: 4+2+2+2+2=12. Even a “C” student in math could probably score this in 15 seconds or less. Compare that to the APHAB, where there are 24 items, and the answer to each item could be 99%, 87%, 75%, 50%, 25%, 12%, or 1%.
Utility. This characteristic relates to the extent to which the data from the scale can be readily applied for treatment, planning, hearing aid adjustment or counseling.
Example: The inventory with the best utility is the COSI, simply because the patient creates the inventory item that is evaluated and scored. If one of Bob’s items is “Understanding my granddaughter when we are playing cards,” his rating of this item will have great utility relative to counseling. We’ll again use the APHAB as a counter example, as its utility is lower. Let’s take the subscale of listening in reverberation, where there are six items. On Form A, these items are:
- I miss a lot of information when I’m listening to a lecture.
- When I am talking to someone across a large empty room, I understand the words.
- I have trouble understanding the dialogue at a movie or in a theater.
- When a speaker is addressing a small group, and everyone is listening quietly, I have to strain to understand.
- It’s hard for me to understand what is being said at lectures and church services.
- I can follow the words of the sermon when listening at a religious service.
You are seeing your 80-year-old patient on a follow-up visit 3-weeks after her new fitting. You are conducting the “aided” APHAB to compare it to the unaided you did earlier, to see if there is a significant aided improvement. How many of the six situations above do you think your patient experienced in the last three weeks?
Important Technical Elements
There are many technical elements that are critical in the development of a self-assessment scale—things that we usually don’t think much about, such as appropriate eigenvalues, Cronbach alphas, and factor loading—never fear, we won’t be talking about them here. What we will be talking about goes back to the Cox (2005) article, where she identified four technical elements that we should consider when evaluating different self-assessment inventories: norms, reliability, validity, and sensitivity. The following is adapted from her article, with some additions from Ricketts et al, 2019.
Norms. The availability of published normative data can be very helpful to the audiologist for patient counseling. Patients typically are very interested to hear how they are performing compared to others with similar hearing loss, people their age with normal hearing, or even young normal hearing listeners. For testing following the hearing aid fitting, it also is a way for the audiologist to provide the patient with a “shot in the arm,” assuming that the patient is performing at or above normative values. The APHAB has very useful plots, generated by the software. These will compare the patient’s results to several different “normative” or “average” percentile values. The COSI, on the other hand, doesn’t really have norms, as each item that is rated is unique to the patient.
Reliability. This relates to the consistency of responses for a given inventory across different tests and different testers. As reviewed by Ricketts et al (2019), this is critical for the audiologist, as before changes to the fitting, or specific counseling is conducted, it is important to know what extent the patient’s responses will vary, simply by chance, if the test were administered on another day, or by another person? Critical differences have been calculated for several inventories and can be used in the same manner as when conducting speech-in-noise testing (Mueller et al, 2023). That is, if the patient is tested at two different intervals, or if two different fittings were employed, the findings from the inventories can be compared to determine if the differences scores reflect a true change in the patient’s opinion. Is a score of 16 on the RHHI-S really different from a score of 12? Fortunately, for the APHAB, Robyn Cox (1997) provides guidance on this topic in her Hearing Journal procedures article.
Validity. We consider an outcome measure valid if it truthfully measures what it purports to measure. One way to look at this would be to determine if the test results in scores that have a predictable relationship with other validated outcome measures that are purporting to measure the same domain. For example, the APHAB assesses benefit, as does the COSI, so we would expect these two scales to agree (assuming the patient selected COSI listening conditions similar to what are on the APHAB).
Another method to attempt to assess validity is to compare the self-report scores to an objective test (e.g., improvement on the QuickSIN compared to the Background Noise scale of the APHAB). This can be tricky, as many clinical tests do not closely mimic the patient’s real-world listening experience. For example, the observed benefit for the speech-in-noise test in the clinic might have been obtained for speech at 72 dB SPL, with an SNR of -4 dB. In the real world, the patient is responding to the speech-in-noise questions based on listening to speech of 62 dB, with an SNR of +5 dB.
Sensitivity. A final technical issue is the sensitivity of the questionnaire. That is, will it detect performance, or changes in performance that is of interest to the audiologist? A bilateral versus a unilateral fitting? New technology versus the patient’s old hearing aids? Premier hearing aids versus a pair of inexpensive OTCs? It’s much easier to see significant differences for these sorts of things in clinical testing. It’s very possible that a scale may effectively differentiate aided versus unaided but will not be very good at pulling out more subtle amplification differences. Now, this might prompt a fan of laboratory testing to say that this is exactly why we should let the lab results guide us. On the other hand, the proponent of self-assessment measures might counter with: “If it doesn’t make a difference in the real world, do we really care?”
Patient Effects to Consider
In an excellent review article published 20 years ago titled “Measuring hearing aid outcomes—Not as easy as it seems,” among other things, Saunders et al (2005) reviewed some the patient factors that we should consider when conducting self-report measures. The following is a summary of this issue, adapted from their publication.
Personality. Consider that personality can affect the types of activities in which an individual participates—those who are active, and involved with others have a much higher demand on communication. Personality also affects the way in which an individual reacts to a particular situation and might determine if the listening experience is stressful. Personality can affect how our patients perceive the behavior of others in a particular situation. Do they view them as supportive?
Research which has examined personality and its relationship to hearing aid use has found the following (adapted from Sanders et al, 2005):
- Gatehouse (1994) reported that the personality traits of depression, hysteria, obsession, and anxiety each played a significant role in explaining variance in hearing aid use and/or hearing aid satisfaction. Interestingly, the traits of depression and anxiety also significantly explained the variance in aided objective performance benefit.
- Cox et al. (1999) showed that the personality traits of extroversion, anxiety, and locus of control explained the significant variance in reported hearing aid benefit (as measured by the APHAB).
- Garstecki and Erler (1998) found that women who used hearing aids had greater ego strength and higher internal locus of control than female nonusers, traits that were not observed for their male participants.
Expectations. Earlier in this paper, we mentioned that the COSI can be used at the time of the initial fitting to assess patient expectations. This is particularly useful, as the expectations expressed are for the listening situations specifically selected by the patient to be the most important. We know that before obtaining hearing aids, patients naturally have expectations regarding the benefit that will be obtained. Research has shown that these expectations can affect individuals’ willingness to obtain hearing aids, their use of hearing aids after the fitting, and the reported benefit and satisfaction with hearing aids (Saunders et al, 2005).
Attitudes. It’s not surprising that the patient’s attitudes toward hearing loss and hearing aids can impact outcomes. As reported by Saunders et al, 2005, studies related to attitudes have shown:
- Hearing aid use is lower among individuals reporting general negativity toward amplification.
- Hearing aid use is also lower for those who perceive that their hearing impairment has little impact on their lives, and those who consider hearing aids to be stigmatizing
Some Final Procedural Points to Remember
If you’re using, or planning on using, self-assessment inventories in your clinic, there are some potential biases that you should consider. Some of them are preventable, others may not be. Remember, when we are dealing with self-assessment inventories, the patient is in charge.
Halo Effect. If the patient likes you, they may inflate the results. Or, if they think that "good" answers are the "right" answers, they might give you "good" answers. Or, if you hand-picked them to try a new product, they might feel obligated to give you the answer they think you want to hear.
Hype Effect. Ever hear how people rave about the wine when they’re in an expensive restaurant? The same wine at Denny’s just wouldn’t taste as good. This effect actually has been studied systematically with hearing aids, which we’ve reported in previous Research Quick Takes. Simply telling patients that hearing aids are “new technology” will improve their self-report scores.
Hawthorne Effect. Named for a study conducted at the Hawthorne Works factory in Cicero, Illinois, a town just south of Chicago. If people believe they are being studied, they will inflate their results (the Hawthorne study had to do with productivity and lighting). Now, granted most clinics aren’t conducting formal studies, but we’re pretty sure that many HCPs have said something like: “This product was just released from Manufacturer X, and is reported to be way better than their previous product. You’re the perfect person to try out a pair for a few weeks.”
A 4th “H” Effect
We actually have a 4th “H” effect, although it’s a bit tangential. We’ll call it the “Henry Effect.” This is named after John Henry, who according to legend, worked on the railroad in West Virginia back in the 1880s, known to be the biggest and strongest of all the workers. He was tasked with hammering a steel drill into rocks to make holes for explosives. When he learned that he was being replaced by a machine, he went up against the steam drill to prove that he could drill a hole through the rock farther and faster than the drill could. The legend says that John Henry beat the steam drill but then died of exhaustion. Let’s hope your patients don’t work that hard!
9.4 Reviewing Some Useful Self-Report Inventories
To this point, we’ve covered most of the background information, so it’s time to review a few of the self-report scales that are associated with hearing aid selection and fitting. As you might guess, there is no shortage of scales to choose from, so we’ll simply select a group loosely based on some combination of available supporting background research, clinician/patient burden, utility and popularity.
Inventories to Assist in Determining Hearing Aid Candidacy
As we have discussed earlier in this paper, one use of self-report inventories is to assist in determining if a given patient is a candidate for hearing aids. While we of course rely heavily on the audiogram, research has consistently told us that the patient’s self-evaluation of his or her hearing cannot be ignored. For example, consider the recent work of Mealings et al (2024) which we reviewed earlier. The participants (n=27) all reported hearing problems on a self-report inventory but had very “normal” hearing: the mean of the four-frequency average hearing loss was ~9 dB. Yet, when fitted with hearing aids, 91% reported improved speech understanding in background noise.
Ideally, the self-report scales we’ll review here would be conducted before the patient’s first visit (via mail, or electronically), or in the waiting room at the time of the visit. The scales we’ll mention are very easy to administer and score, and easily could be managed by an audiometric assistant, or other office personal, with the results then available when the HCP sits down with the patient.
Solodar One Question (SOQ). We’ll start off with a self-report scale that is just one question, which clearly meets the criterion of low patient and clinician burden. This is a scale from an article by Catherine Palmer and colleagues (2009), that we briefly reviewed in Research QuickTakes Volume 8. In a retrospective study of over 800 adults, aged 18-95 years, the authors examined the relationship between the patient’s rating of his or her hearing ability, and their subsequent decision to purchase hearing aids. This inventory doesn’t seem to have a name, but the data collection was from the offices of Atlanta audiologist Helena Solodar, so for our discussion here, we’ll call the scale the “Solodar One Question” or the SOQ.
At the initial office visit, the patients were asked the following question:
“On a scale from 1-10, 1 being the worst and 10 being the best, how would you rate your overall hearing ability?”
The answer to the above question was then compared with whether the patient purchased hearing aids. As we would predict, those that rated their hearing very poorly (e.g., #1, #2 or #3), were very likely to obtain hearing aids—92% or greater. And only a small percent of those who stated that they had relatively good hearing (ratings of #7 to #10) purchased hearing aids (20% or less)—see QuickTakes Volume 8 for more details (Taylor and Mueller, 2024). What perhaps is the most interesting from their findings, is the large difference between the #7 rating (7%), and the #6 rating (58%). While only 1 increment apart, the purchase rate increases by 51%!
As you can tell, the SOQ provides useful information and would be very easy to implement. This one question simply could be added to one of the other scales that we will mention.
Revised Hearing Handicap Inventory (RHHI). This is another assessment scale that we have mentioned before, but we’ll go into a little more detail here. The Revised Hearing Handicap Inventory (RHHI; Cassarly et al, 2020) is a scale that is the merging of the HHIE and HHIA. It’s an inventory that measures the psychosocial handicap that might be caused by a hearing loss. Commonly, this is administered at the patient’s first clinic visit, to assist in counseling, and help determine amplification needs, but also can be used as an outcome measure, as we’ll discuss later.
As mentioned, this is the revised version of the HHIE/HHIA, scales that have been in common use for decades (see Mueller et al, 2013, for review). For clinical purposes, the screening 10-item version is all you need, as this has been shown to have good reliability. We might add, research has shown the RHHI-S will give you results very similar to the HHIE-S, which tend to be very similar the HHIA-S (Cassarly, 2020). Our point is that if you don’t happen to have the RHHI-S handy, using the HHIE-S or the HHIA-S is still much better than not using anything to measure psychosocial factors at all.
Shown in Figure 9.9 are RHHI-S findings for a patient who has essentially normal hearing through 1000 Hz bilaterally, sloping down to 50 dB at 3000-6000 Hz, with right and left earphone QuickSIN scores of 2-3 dB SNR Loss. We usually consider RHHI scores of >6 as suggestive of hearing problems, so a score of 12 places him in the mild category, and coupled with the audiometric findings, suggests that he is a good candidate for hearing aids. If you do fit him with hearing aids, it also provides five areas to focus on when you use this same scale as an outcome measure.
Speech Spatial and Qualities of Hearing Scale (SSQ). The test we want to introduce here is the SSQ5, but first a little background. The original SSQ is a self-report inventory of 49 questions: 14 related to speech hearing, 17 related to spatial hearing, and 18 related to qualities of hearing. As the name suggests, it was designed to measure a range of hearing disabilities across several domains, such as hearing speech in a variety of competing contexts, to the directional, distance and movement components of spatial hearing, and the abilities to segregate and attend to simultaneous speech streams. Qualities such as ease of listening, naturalness, clarity, and identifiability also are assessed. Each item is scored on a 11-point Likert scale, going from 0 to 10. The end points are not all labeled the same, but for most the range is: 0=Not at All, and 10=Perfectly.
While useful for research, the length of the SSQ has limited its popularity in clinics, and not surprising, the SSQ12 was introduced (Noble et al, 2013). As the name suggests, this self-report uses only 12 of the original SSQ49 items: 5 related to speech hearing, 3 related to spatial hearing and 4 related to qualities. The scoring remains the same as the original SSQ. For the most part, the SSQ and the SSQ-12 have been used as outcome measures, to support the benefit obtained from hearing aid use. This is something we reviewed in Research QuickTakes Volume 1, regarding the benefits obtained from Signia’s split-band processing (Taylor and Mueller, 2023).
In abbreviated form, here are the 12 items of the SSQ12 (Noble et al, 2013):
- Talking with one person with TV on
- Talk with one person and follow TV
- Follow one conversation when many people talking
- Having conversation with five people in noise with vision
- Follow conversation without missing start of new talker
- Locate dog barking
- Judge distance of vehicle
- Identify whether a vehicle is approaching or receding
- Sounds appearing jumbled
- Identify instruments in music
- Clarity of everyday sounds
- Need to concentrate when listening
This now takes us to the SSQ5 (Demeester et al, 2012), which rather than an outcome measure, has been suggested as a complimentary screening tool to be used with the pure-tone audiogram, to assist in identifying those with hearing problems. The general thought is that it is important to look both at impairment and disability (activity restrictions).
The items of the original SSQ were reduced to five by cluster analyses and binary logistic regression analyses. The robustness of this five-item version (SSQ5) was determined in three control populations: an adult 25- to 55-year-old population (n = 159), an ENT-patient population (n = 60), and a population of hearing aid candidates (n = 50). Compared with the single question: "Do you have hearing loss?" the use of the SSQ5 had 37% more maximum discriminatory power for determining hearing status category based on speech-in-noise performance. Based on cluster and logistic-regression analyses, the five items that were found to be the best predictors of hearing problems are shown in Figure 9-10. Interestingly, given that the scale primarily is intended to help identify individuals having trouble understanding speech, only one of the 14 speech questions from the original SSQ was used.
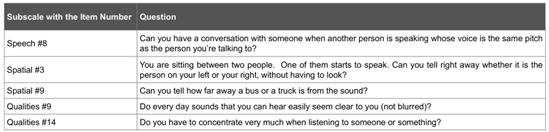
Figure 9-10. The five items of the SSQ5. The far-left column shows the origin of these items from the SSQ49.
Once a busy clinician begins using this screening tool, the first question of course is: What are normal or abnormal findings? To our knowledge, there are not published charts (like there are for the HHIE/A) which define “normal,” “mild loss,” etc. What we can do, however, is to examine data from other studies when these five questions were used as part of a larger sample (e.g., SSQ49). Now, you could argue that when used with 40 or more other questions, the results would be somewhat different than when only used in a group of 5, but these differences should be small.
We can first look at the scores that were obtained for these items in the research of Gatehouse and Noble, 2004, for individuals with hearing loss—these are shown in Table 9-1. There were 153 people in the sample (80 females, 73 males), of average age 71 years (SD 8.1). The better-ear PTA (500, 1000, 2000 and 4000 kHz) was 38.8 dB (SD 15.5). When giving the SSQ5 to someone with a significant hearing loss, these values can serve as a general method to evaluate the extent of the problem.
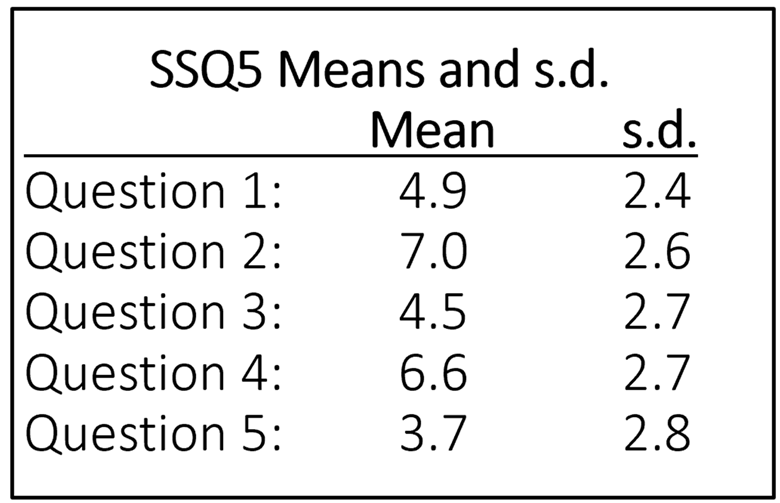
Table 9-1. Means and standard deviations for the 5 items of the SSQ5 for individuals with mild-moderate hearing loss. Data from the SSQ49 study of Gatehouse and Noble, 2004.
We also might want to compare our SSQ5 findings to individuals with normal hearing. For this, we can look at the mean data for each of the 5 items from Demeester et al, 2012, which are shown in Table 9-2 (n=103). Note that, like the findings for the hard-of-hearing group (Table 9-1), mean performance was the lowest for Items #1 and #5. One method to obtain a general idea of the person’s self-reported hearing problems, is to take an average of the 5 items, this is referred to as the “total” score, or TSSQ5. The average for the means shown in Table 9-2 is 8.2, compared to a TSSQ of 5.3 for the data shown in Table 9-1 for the hard of hearing.
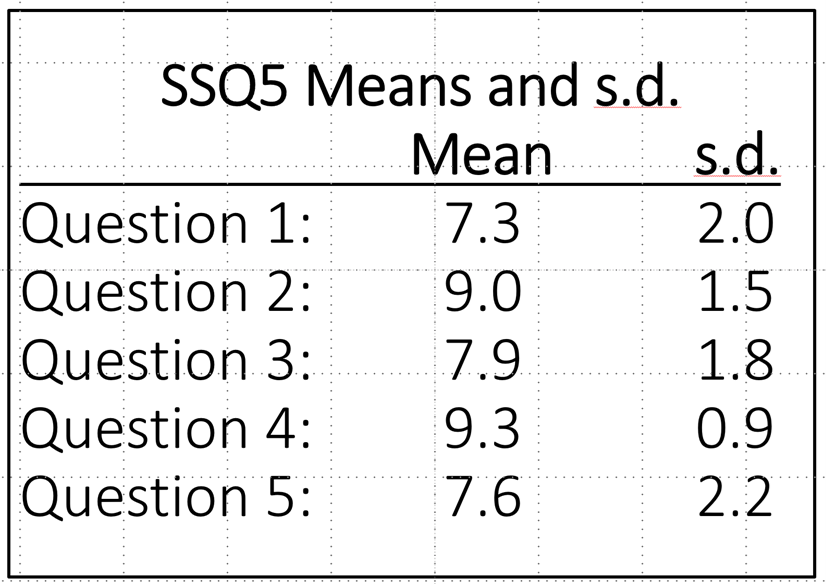
Table 9-2. Mean and standard deviation findings for the SSQ5 for individuals with normal hearing (from Demeester et al, 2012).
Assef et al (2022), found with research with the TSSQ5, that the cut-off point with optimal balance between sensitivity and specificity was 7.3; 81.8% sensitivity and 78.3% specificity. Of course, if we assume that the self-report SSQ5 is assessing something different than what is displayed on the audiogram, then we can’t really use the audiogram as the gold standard to calculate sensitivity and specificity. While we wouldn’t expect a one-to-one agreement between the TSSQ5 and the TSSQ12, Cañete et al., 2022 suggest that when using the TSSQ12 as a screening tool for hearing loss, a TSSQ12 score of ≤ 8.5 points should be considered as the cut-off point for hearing problems—very similar to our calculated 8.2 RSSQ5 value (mean of means) shown in Table 9-2.
Since we’re talking about the SSQ, it is worthwhile mentioning a recent study which compared SSQ findings to hearing loss, speech-in-quiet, and speech-in-noise word recognition scores (Fitzgerald et al, 2024). It’s important to point out, that while this study used five SSQ questions, they did not use the SSQ5, but rather, the five items from the “speech hearing” section of the SSQ12, which they labeled the Speech5. We know from SSQ12 research, that individuals tend to score slightly lower for the speech items than items in other sections, and this is what the authors found (See Table 9-3).
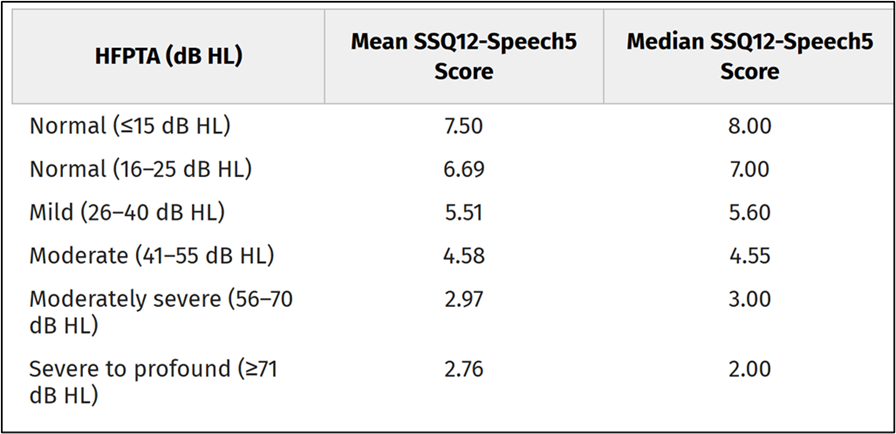
Table 9-3. Mean and median scores for the average of the 5 speech understanding questions of the SSQ12 for different hearing loss levels (adapted from Fitzgerald et al, 2024).
Mean and median scores for the average of the 5 speech understanding questions of the SSQ12 for different hearing loss levels (adapted from Fitzgerald et al, 2024).
Note that when the cut-off for “normal” was 25 dB, the mean SSQ-Speech5 score was 6.69, compared to 8.2 for the SSQ5. In case you’re curious, these researchers found that degree of hearing loss (i.e., HFPTA) and the QuickSIN SNR loss were predictive of SSQ12-Speech5 scores. They also note that HFPTA and QuickSIN SNR loss (but not words-in-quiet testing) accounted for a significant amount of variance in SSQ12-Speech5 scores and were largely effective at predicting which patients are likely to report greater perceived auditory disability (Fitzgerald et al, 2024). It seems possible that the SSQ12-Speech5 also could be considered as a simple screening tool.
Inventories Conducted Before, or at the Time of the Fitting
At this point, we have now determined that our patient is a candidate for hearing aids, and we need to implement the self-assessment inventories that relate to this experience. Depending on how the hearing aid fitting scheduling process is handled, these could be conducted on the day of initial visit following the diagnostic exam, or on the actual day of the hearing aid fitting. Some of these scales are geared as a needs assessment, some assist in determining the potential acceptance of hearing aids, and others are used to provide an unaided baseline, so that aided benefit can be measured at a later date.
Client Oriented Scale of Improvement. The Client-Oriented Scale of Improvement (COSI) is probably the most popular self-assessment inventory used in clinical audiology and one we have mentioned several times already in Research QuickTakes. For the unfamiliar, the COSI is often used during the hearing aid evaluation appointment to target and document up to five listening situations where the patient is having communication difficulty, and where hearing aids will provide benefit. It is considered an open-ended self-report because, rather than rely on a pre-established list of situations (like the APHAB) to choose from – the COSI relies on the patient and the clinician working together to create an individualized list, tailored to the needs of the patient. Developed at the National Acoustic Laboratories almost 30 years ago (Dillon, James & Gillis, 1997), the COSI captures two dimensions of outcome: final ability and degree of improvement, using a 5-point scale. For now, we will discuss how the COSI can be used during the initial information gathering part of the hearing aid evaluation. In the latter part of this section, we will discuss how the COSI is used as an outcome measure of benefit during follow-up appointments.
Using the COSI during the hearing aid evaluation is straightforward. The process begins by having the patient identify up to five specific listening situations in which he or she would like to hear better. Recording “hearing in background noise” on the COSI is not specific enough. After some back-and-forth discussion between the patient and the clinician, this item might be narrowed to “engaging in conversations with my friends at the local diner during breakfast.” Each situation is recorded on the area of the COSI labeled, specific needs.
After all listening situations important to the patient are identified, it is then helpful to go back and review and rank all situations. Simply place a “1” for most important, “2” for second most important, and so on in the small box to the left of the item. Often, the item that the patient mentions first is something that just happened recently but is not the most important. Therefore, we have found it is helpful to ask the patient to list the two “most important” listening situations. These “top two” can be targeted first for improvement with hearing aids.
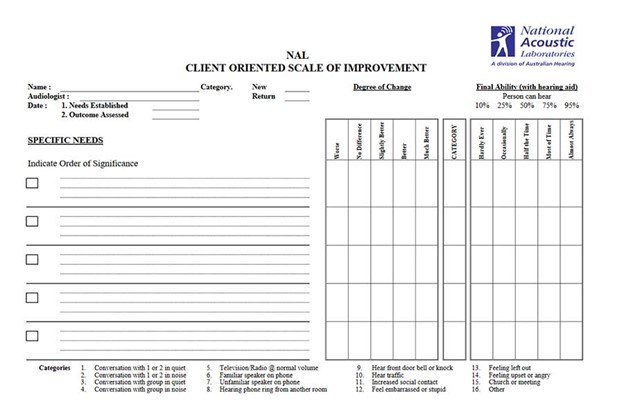
Figure 9-11. A blank COSI.
Patient Expectations Worksheet (PEW). As the name implies, the Patient Expectations Worksheet (PEW) uses the list of specific listening situations targeted for improved communication with hearing aids recorded on the COSI to establish patient expectations. Even inexperienced clinicians know that expectations can influence outcomes. For example, exceedingly high expectations can lead to disappointment, including returns for credit and hearing aid non-use. In contrast, a patient with too low expectations, although easy to satisfy because their expectations are -well- low, probably is not receiving the service and attention they deserve. For these reasons, the Patient Expectations Worksheet (PEW) is an easy way to align the individual’s expectations with final outcomes.
The PEW was originally created by Palmer & Mormer (1999). Their use of the PEW comes from their own clinical experience using the COSI. They discovered that after three weeks of hearing aid use, 96% of the patients nominated the same two items on the COSI, but no patient who originally nominated four items, nominated the same four items on the return visit. Thus, they determined that after recording a list of 4-5 specific situations on the COSI, simply ask the patient, “what are the two items that are most important to you?” These become the situations or goals targeted on the PEW.
Here is how the PEW can be completed using two items from the COSI: As usual during the pre-fitting appointment, designate and record up to five goals on the COSI. In the example in Figure 9-12, you can see the “top two” items this patient has targeted for improvement with hearing aids. Next, after these items have been recorded on the PEW, using the 1 to 5 scale, the patient indicates how often he is successful in the situation currently (C), prior to hearing aid use, and how he expects to function after the intervention (E). The “E” stands for expectations. Then, the audiologist marks the PEW with an X-mark (“X”) to indicate what she believes is a realistic expectation for that individual. The judgement of the clinician – where the “X” is placed for each goal – is based on the clinician judgement of the audiologist, including of course all the audiologic and non-audiologic information of the individual gathered during the pre-fitting appointment.
Based on our experience, assessing both the individual’s self-reported functional communication ability and his expectations using the 1 to 5 scale is a great way to individualize care and optimize benefit in a collaborative manner. Figure 9-12 shows an example of a completed PEW in which the patient’s expectations and the audiologist’s judgments of success are fairly well aligned.
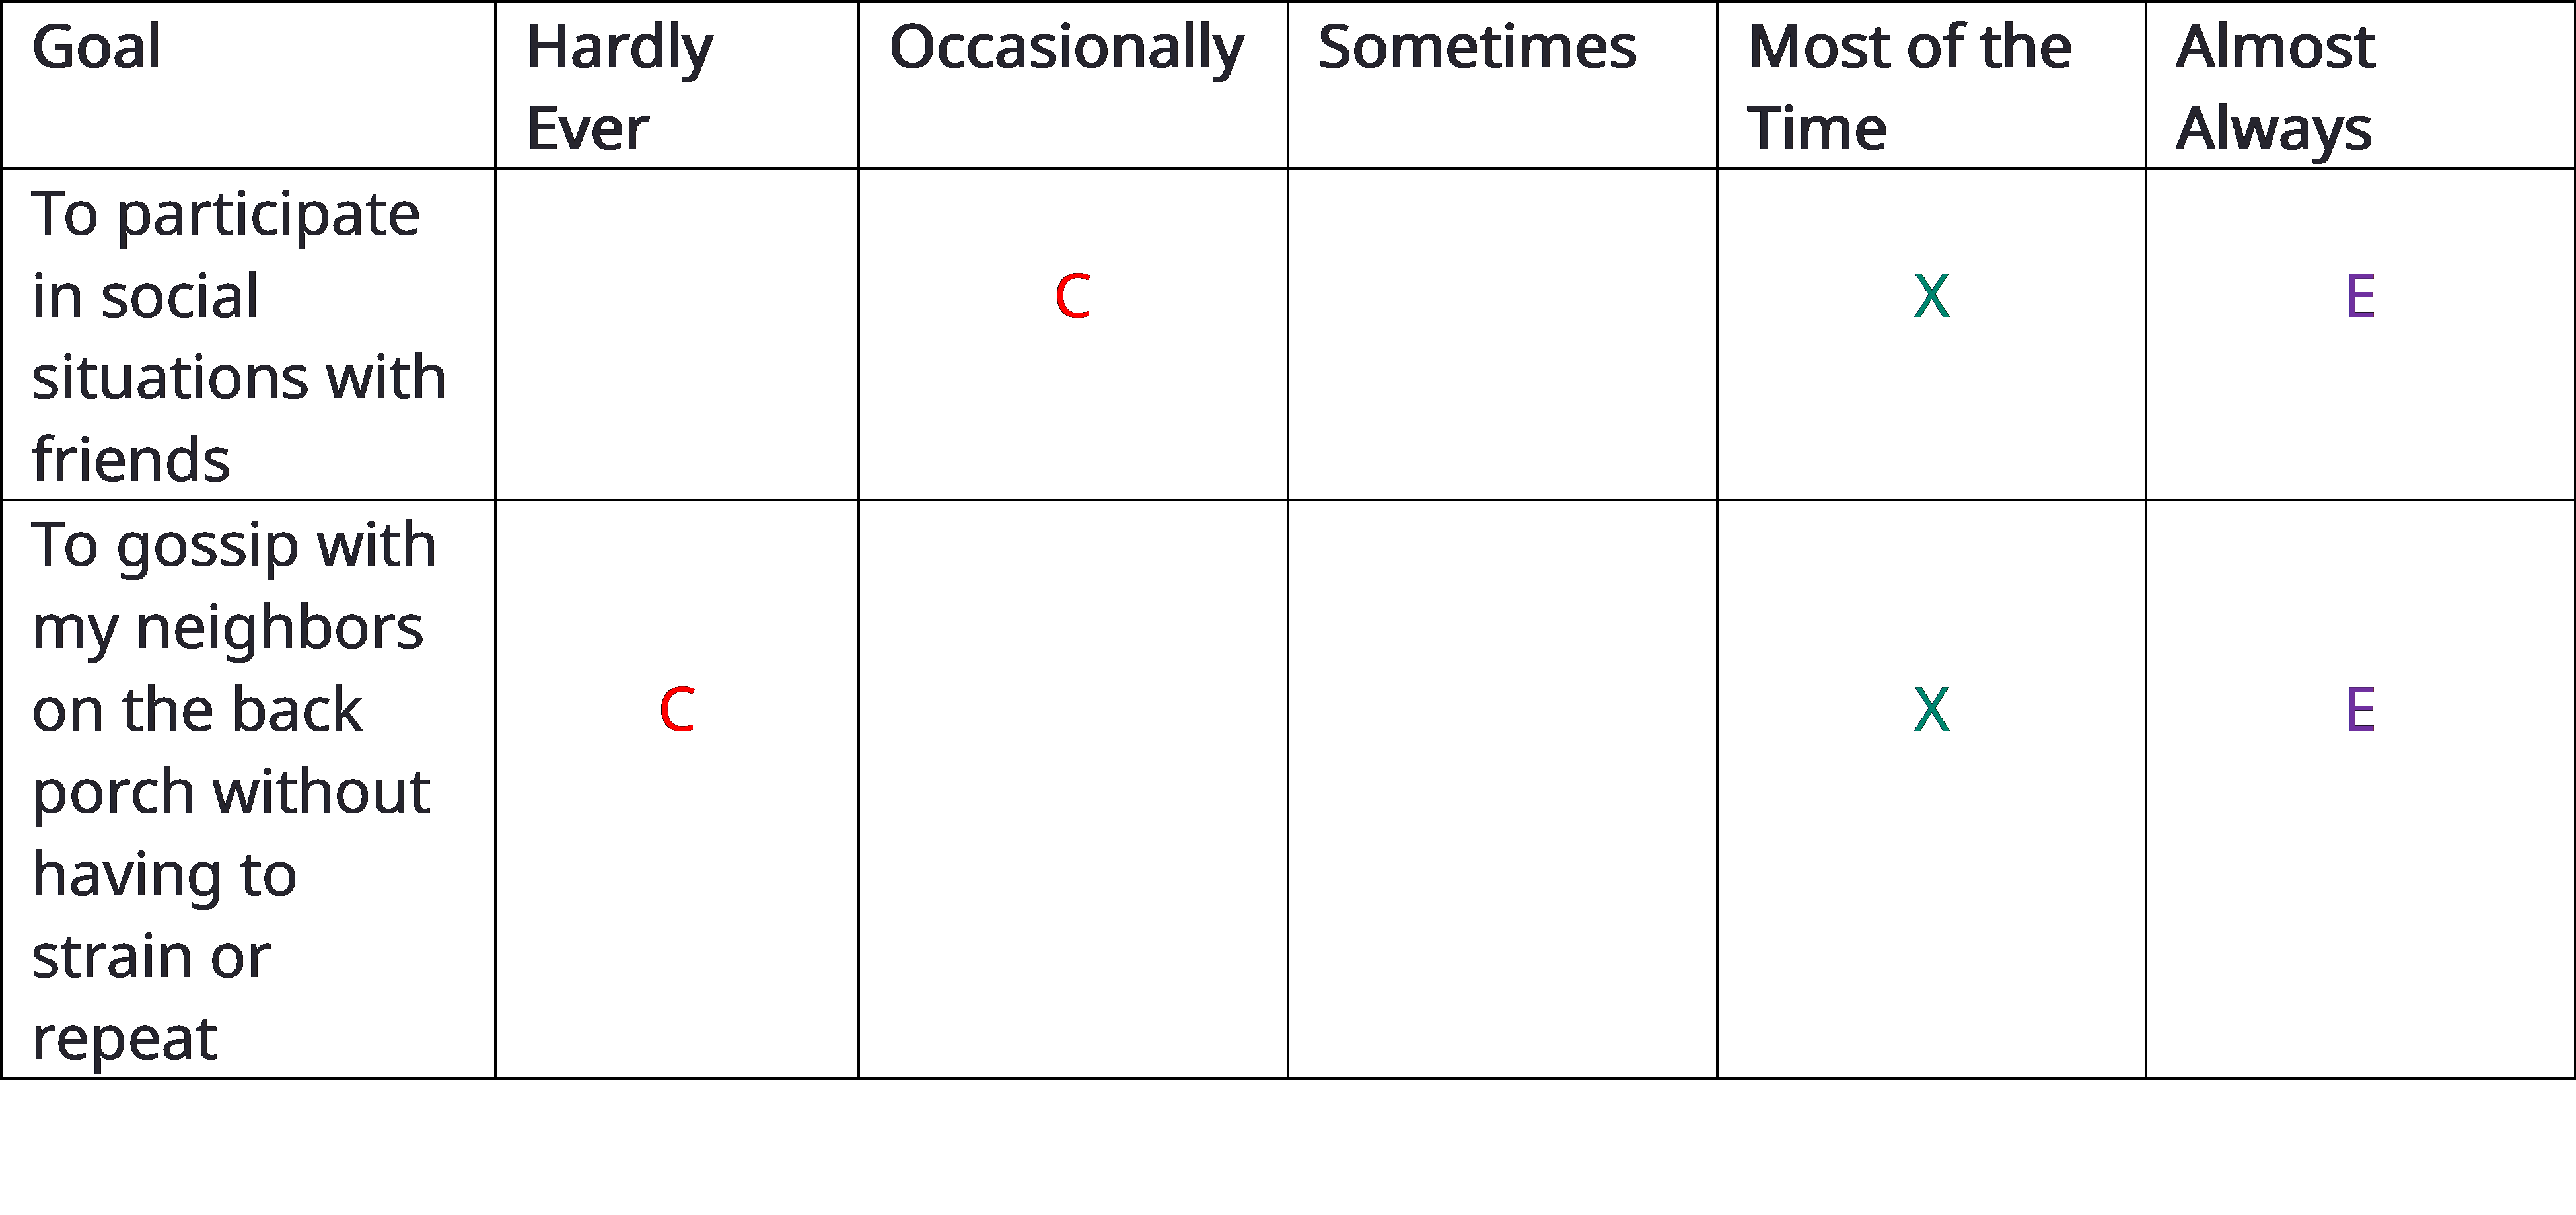
Figure 9-12. An example of the completed PEW. C = how patient rates their current ability to communicate, E = how the patient expects to communicate post-intervention, X= audiologist’s judgment of what outcome the patient will achieve.
Expectations out of alignment: Occasionally the “E” of the patient and “X” of the clinician will not agree. In practical terms, this occurs when the “E” and “X” are separated by two or more categories. For example, the patient may state his expectations in the “almost always” category, while the clinician believes that realistic expectations fall in the “sometime” category. When expectations don’t align, the audiologist counsels the patient until he understands why his expectations might be too high or too low. Alternatively, when patient and clinician cannot align on expectations, a conversation about modifying the planned intervention must take place.
Determining your “X”: A critical part of conducting the PEW is the clinician’s ability to provide a prognosis on the outcome of each targeted goal recorded on the COSI. This determination relies on sound clinical judgement and experience. However, the clinician should use the results of objective tests like the pure-tone audiogram and QuickSIN, as well other dimensions such as the patient’s perceived attitude toward wearing hearing aids and family support when deciding where to place the “X” on the 1 to 5 scale.
By allowing patients to weigh in on their post-fitting expectations and comparing those expectations to the clinician’s expectations of that patient, we believe the PEW is an excellent vehicle for having a deeper, more person-centered dialogue about expected treatment outcomes.
Characteristics of Amplification Tool (COAT). Before talking about the COAT, it’s appropriate to first mention the Hearing Aid Selection Profile (HASP; Jacobson et al, 2001). The HASP consists of 40 statements. The patient indicates level of agreement to each statement using a 5-point Likert scale ranging from "strongly agree" (4-points) to "strongly disagree" (0 points). The 40 statements are divided into 8 subscales (5 statements each subscale). Three subscales address issues directly related to hearing aids (see Mueller et al, 2013 for review of the HASP).
The developers of the COAT (Sandridge and Newman, 2006), after using the HASP is the clinic, report that while this inventory has documented psychometric adequacy and clinical usefulness, it is not time-efficient, limiting its application in a busy clinical practice. Therefore, they developed the COAT. Some of the general goals were: similar constructs to the HASP; short in length so that it could be completed in 10 minutes or less; easy to administer and interpret; and function as a basis for counseling during the HA selection appointment. The original COAT (from Cleveland Clinic) can be downloaded from a link at the end of the original article: https://www.audiologyonline.com/articles/improving-efficiency-and-accountability-hearing-995
The original COAT was a 9-item instrument. Given that this was 20 years ago, some aspects of hearing aid dispensing have changed. We’d like to suggest the use of an abbreviated 6-item version of the COAT, which for lack of a better term, we’ll call the ACOAT. The six remaining items are identical to the original COAT. The three items we eliminated were questions about: Q6: automatic signal processing (which is now in all products), Q7: preference for six different hearing aid styles (a procedure seldom used in clinics today) and Q9: preferences for cost of the hearing aids (a discussion most clinicians prefer to deal with more personally). The revised ACOAT is in Figure 9-13.
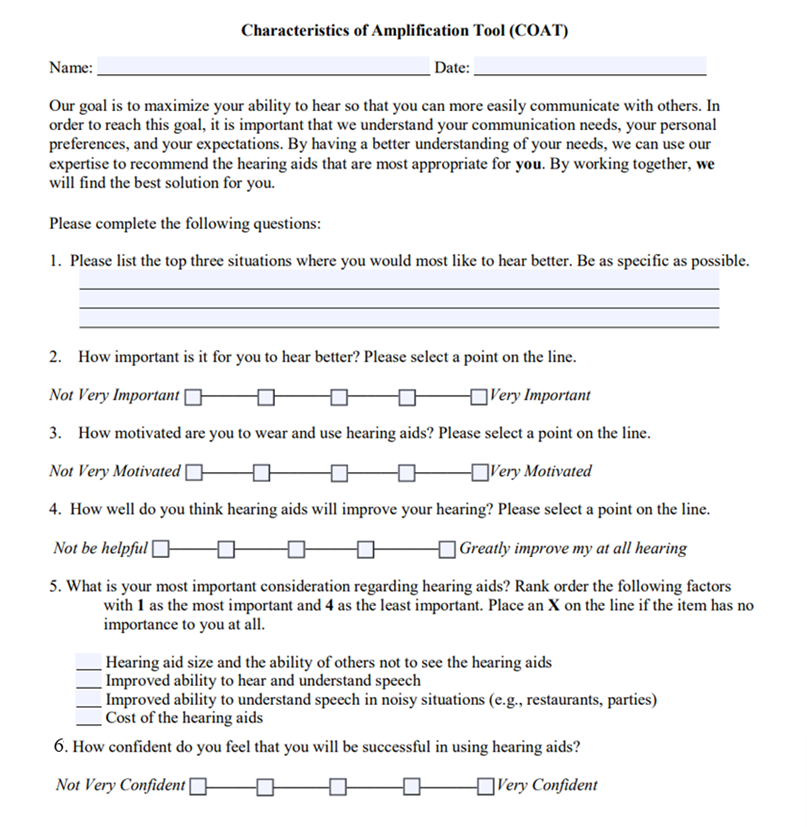
Figure 9-13. Abbreviated COAT questionnaire. (Portions are adapted from: https://www.sacredheart.edu/media/shu-media/audiology-clinic/COAT-ADA.pdf).
Like the COSI or PEW, the ACOAT is not a scale where you’ll be looking at the results, and then taking means and standard deviations, or calculating whether a patient fits into a given category. Rather, think of it as a handy way to enhance (and document) your case history procedure. This is an easy scale for patients to understand and easily could be administered via mail, or in the waiting room prior to the appointment.
Hearing Aid Attribute & Feature Importance Evaluation (HAFIE). One of the biggest changes in hearing aids over the past decade are their compatibility with smartphones and other Bluetooth-enabled consumer electronic devices. Today, nearly all hearing aids can be connected to the patient’s smartphone. The challenge, of course, is that some patients do not want or need their hearing aids to be wirelessly connected to their smartphone, while others find wireless compatibility to be absolutely essential. Determining who prefers these wireless features, is one of the key self-assessment components of the recently developed HAFIE (Saleh, et al 2024). Similar to the ACOAT, the Hearing Aid Attribute and Feature Importance Evaluation (HAFIE) is a questionnaire used by audiologists to assess how important different features and attributes of a hearing aid are to a potential user, helping them select the most suitable hearing aid based on the individual's priorities and needs; essentially, it gauges which features a patient value most in a hearing aid. The HAFIE is divided into nine sections: Smartphone-based Technology, Multi-environment Functionality, Comfort and Appearance, Convenience and Connectivity, Ease of Use, Audibility and Speech Intelligibility, Streaming, Batteries & Charging, and Hearing Aid Styles. It uses a 5-point Likert scale. The creators of the HAFIE have also developed a 14-item shortened version. Given the availability of several wireless features on modern hearing aids, gathering just how important these features might be to the patient would seem to be a good use of clinical time. For example, if a patient marked on the HAFIE that any of these items: streaming, connectivity & convenience or smart-based technology as “very” or “extremely” important, they would be excellent candidates for hearing aids in which those features are activated, and that, in turn, he or she is well versed on how to use those features. The short version of the HAFIE can be downloaded from the Western University National Centre for Audiology website here.
The ACOAT and HAFIE are examples of self-assessments that are structured questionnaires with questions about different hearing aid attributes, in which patients rate the importance of each feature on a scale. They help clinicians tailor hearing aid recommendations to individual needs, provide valuable insights into patient priorities when selecting a hearing aid, and can be used to identify trends in hearing aid feature importance across different patient populations.
Expected Consequences of Hearing Aid Ownership (ECHO). As the name indicates, the Expected Consequences of Hearing Aid Ownership (ECHO; Cox & Alexander, 2000) is all about expectations. Although we have already reviewed the PEW, which is a quick way to gauge expectations using the COSI, let’s take a look at another self-assessment that systematically evaluates patient expectations – and has data beyond it supporting its efficaciousness. It is generally believed that expectations can impact satisfaction. We are reminded of Benjamin Franklin’s often repeated statement: “Blessed is he who expects nothing, for he shall never be disappointed.” While it might seem that someone with low expectations would be easier to please with hearing aids, that might not be true. For example, Schum (1999), found that patients who expected more help in noisy situations reported that they received more help in this listening condition. And relative to our discussion here of the ECHO, Cox, and Alexander (2000) report that for the Positive Effect subscale, there was a significant positive correlation between higher expectations and greater satisfaction. The authors point out, however, that this could likely be related to a third variable, such as optimism.
The ECHO was introduced by Cox and Alexander in 2000. It was designed to be a companion scale for the SADL (Satisfaction of Amplification in Daily Life (SADL; Cox et al., 1999), which we will discuss later in this section. The ECHO consists of 15 items, which are divided among four subscales.
- Positive Effect: Six items addressing the domain of improved performance and function.
- Service and Cost: Two items about service and one item on cost. If the individual is not paying for the hearing aids, the cost item is omitted.
- Negative Features: Each of the three items in this subscale addresses a different potentially negative aspect of hearing aid use.
- Personal Image: Addresses the domain of self-image and hearing aid stigma.
There are a total of 15 questions, and each question is scored on a 7-point scale, indicating the extent that the patient agrees with the statement, ranging from A=Not at All, to G=Tremendously.
Once the answers have been scored, the average values are plotted on the ECHO Reality Norms form shown in Figure 9-14. “Reality Norms” meaning that this is what you might expect from the average patient seeking amplification. The black circles on the form for each category represent the mean, and the gray bars illustrate the 20thth to 80th percentile score.
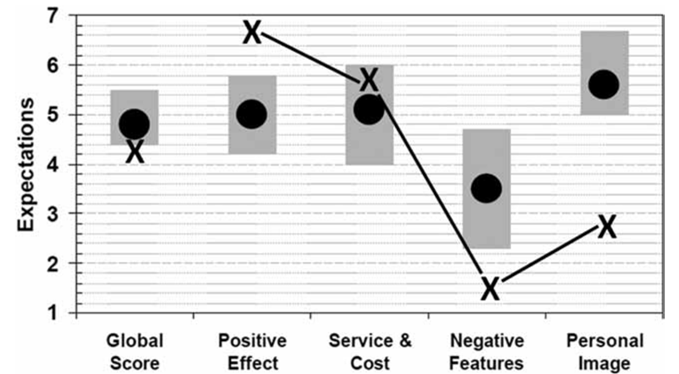
Figure 9-14. Score sheet for the ECHO. Black dots represent mean performance for average individuals with hearing loss (reality norms). The gray bars represent the 20th to 80th percentile score. The “X’s” on the chart are the scores for a given patient.
Abbreviated Profile of Hearing Aid Benefit (APHAB). When we assess benefit, we usually want to look at disability (activity limitations)—speech understanding in quiet and in noise for example—and determine if improvement has been made in this area. A good scale for obtaining that information is the Abbreviated Profile for Hearing Aid Benefit, known as the APHAB (Aye-Fab). In order to assess benefit, we need an unaided baseline, which is why it’s useful to administer the APHAB at the time of the fitting.
As recently reviewed by Mueller (2025), this inventory goes back about 30 years (Cox and Alexander, 1995). The APHAB is a shorted version of the original PHAB, two of the many excellent self-assessment scales developed by Robyn Cox and her colleagues at the University of Memphis, where the scale (and many others) is available for download from the University of Memphis Hearing Aid Research Lab (HARL: https://harlmemphis.org/wp-content/uploads/2020/05/APHAB_A.pdf.
The APHAB is 24 questions divided into four categories of 6 questions each: listening in quiet, in background noise, in reverberation and aversiveness to loud sounds. Each statement is rated on a 7-point scales going from A=Always (99%) to G=Never (1%). The statements are carefully designed so that if the patient has a fairly severe hearing loss, “A or B” might be the correct response for some statements, but “F” or “G” might be the appropriate response for others—this helps identify the patients who are not carefully reading the statements or may not have the cognitive skills to provide reliable results. The APHAB is probably the most used self-assessment scale world-wide and has been translated into over 20 different languages. The test can be administered via paper/pencil or from a laptop. The scoring does get a little tricky, but there is handy software available from the HARL. The APHAB software also is included in the HIMSA Noah 4 Questionnaire Module. The software not only will score the APHAB but will plot out the findings to assist in interpretation.
In addition to using the unaided scores to calculate benefit at a later date, we’ve found these unaided scores to be helpful at the time of the fitting. For example, let’s take Scale EC: ease of communication (i.e., listening in quiet), and Scale BN: listening in background noise. We would expect the percent of problems for the EC to be in general agreement with the audiogram thresholds and unaided SII (if available), and the percent of problems for the BN to be consistent with our QuickSIN findings.
In Figure 9-15, you see the APHAB scores for the four different APHAB subscales for a patient with a mild high frequency loss. This is “percent of problems,” so low scores are good. What we are looking at in Figure 9-15 is his unaided APHAB compared to the norms for “elderly with few/no problems” (there is a similar chart for young normal hearing). The speech-in-quiet scores are quite good (EC Scale), only 10% problems (35th percentile). The speech in background noise (BN Scale) is at the 80th percentile (elderly individuals with normal hearing), so actually pretty good, and about what we might expect given his QuickSIN performance. Often, these findings help in determining the overall treatment plan, and pre-fitting counseling.
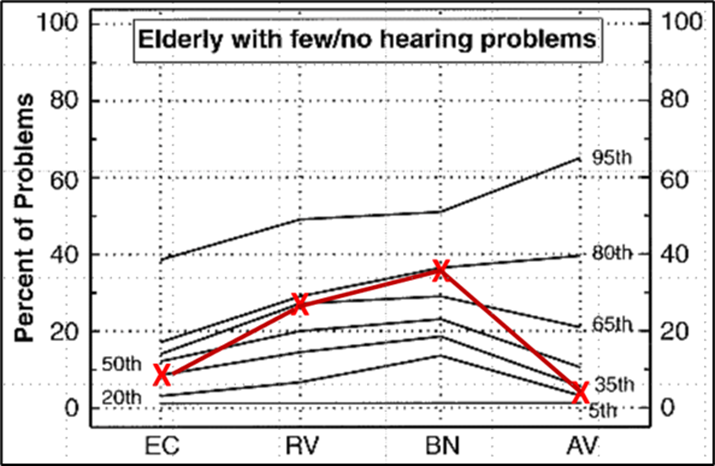
Figure 9-15. Unaided APHAB scores for patient with mild high-frequency loss. EC: ease of communication (listening in quiet), RV: listening in reverberation, BN: listening in background noise, and AV: aversiveness (annoyance of loud sounds).
Self-Report Scales Used as Outcome Measures
Now that we have discussed several self-assessment scales that can be completed prior to hearing aid use, often during the hearing aid evaluation appointment, we turn our attention to self-assessment scales that measure benefit. The most common type of outcome we measure is benefit. Hearing aid benefit refers to the improvement in communication ability, quality of life, and overall auditory function experienced by hearing aid wearers. Benefit is simply the difference between unaided (often called the baseline) and aided performance or ability as measured on a self-report scale. Therefore, many of the self-assessments that we covered in the previous section that are completed in the unaided condition are readministered a few weeks or months later after hearing aid use and become outcome measures of benefit.
Revised Hearing Handicap Inventory (RHHI). See our review of this scale earlier in this section. In addition to using this assessment to help determine candidacy, it is useful to administer this inventory following hearing ais use. It is then possible to determine if psychosocial improvements have occurred. The clinician can focus on areas where pre-fitting problems were noted (see Figure 9-9). For example, the unaided score on the RHHI in Figure 9-9 is 12. When the RHHI is re-administered 1 month after the hearing aid fitting, you would expect a lower score which would be an indication of psychosocial improvement.
Abbreviated Profile of Hearing Aid Benefit. This scale also was reviewed earlier. At the time of the fitting, we established an unaided baseline. We now can assess benefit for the different subscales (note: we do not expect “benefit” for the Aversiveness Scale—see aided norms). Considerable research for the APHAB has been conducted, and it is possible to compare the patient’s aided findings to several different sets of norms: young normal hearing, elderly normal hearing, new hearing aid users, etc. These charts are available at: https://harlmemphis.org/. As we mentioned earlier, the patient's results also will be automatically charted as part of the questionnaire module of Noah: https://www.himsa.com/products/noah-compatible-products/noah-modules/noah-modules-from-himsa/noah-4-questionnaire-module/
An example of a plotting of APHAB benefit is shown in Figure 9-16 —this is for a patient with a moderate-severe hearing loss. Notice that for the Background Noise (BN) scale, his percent of problems were reduced by 40%, placing him in the ~60th percentile, based on aided data from other hearing aid users with similar hearing losses. As we mentioned earlier, we do not expect a “benefit” for the Aversiveness Scale (note that the 50th percentile is -10). For our sample patient, however, the percent of problems increased by much larger ~30-35% with hearing aid use. This is greater than expected, and is something we will address in counseling, and a check of the real-ear MPO also might be useful, to ensure that it is not exceeding his LDL.
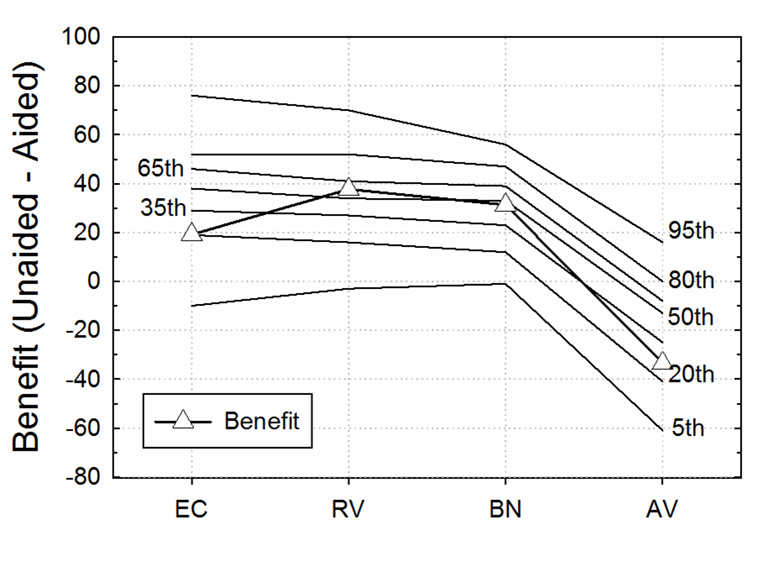
Figure 9-16. Benefit for the APHAB for the four subscales, plotted on chart representing average findings (percentiles) from individuals fitted with hearing aids.
Client-Oriented Scale of Improvement (COSI). The COSI can also be used as an outcome measure. Recall earlier in the section when we introduced the COSI as a self-assessment in which the patient collaborates with the clinician to identify up to 5 listening situations that could be improved with hearing aids. Now we will discuss how those individualized situations that were recorded prior to hearing aid use can be re-evaluated a few weeks or months post-fitting.
Typically, about a month after the fitting, during a routine follow-up appointment, the clinician pulls out the COSI that was completed before the fitting. At this time, the patient is asked to rate on the 1-5 scale their performance for each situation recorded on the COSI. As shown in Figure 9-17, benefit on the COSI can be assessed in two different ways: Degree of Change (improvement provided by the hearing aids) and Final Hearing Ability with Hearing Aids (an absolute measure of communication ability). It is common to see a similar pattern for these two different ratings, but sometimes a difference is noted. For example, a patient with a fairly severe hearing loss who works in a demanding listening situation might rate his Degree of Change as “Much Better,” but have only a Final Hearing Ability of 50%. We suggest having the patient rate both categories because doing so may bring up key issues that need to be addressed.
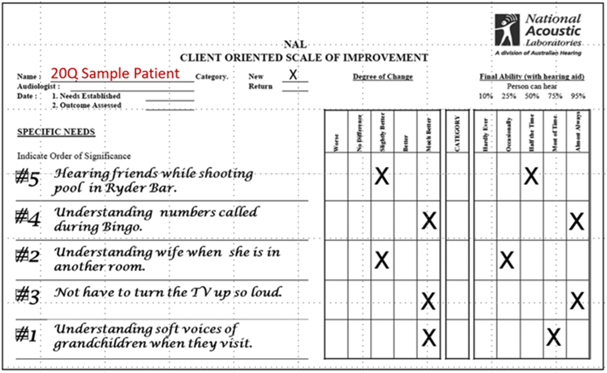
Figure 9-17. The completed COSI form about a month post-fitting (from Mueller, 2025).
The Speech, Spatial and Qualities of Hearing scale (SSQ-12-B). Recall our earlier discussion of the original SSQ with 49 questions and its condensed versions, the SSQ-12 and the SSQ-5. The SSQ-12 creators have developed a “Benefit” version, for use in assessing of abilities pre- and post-fitting, and a “Comparison” version which evaluated self-assessed contrasts between different fitting strategies. Here we focus on the SSQ-12-B as a benefit measure. Like the SSQ-12, the SSQ12-B uses an 11-point Likert scale. The major difference is how the scale is used. As noted in the bottom panel of Figure 9-18, the middle of the scale “0” represents the starting point prior to hearing aid use. If the patient self-rates their ability in the aided condition to be better, they place a mark on the “+” side of the scale, and if they rate it worse, they place a mark on the "-"side of the scale.
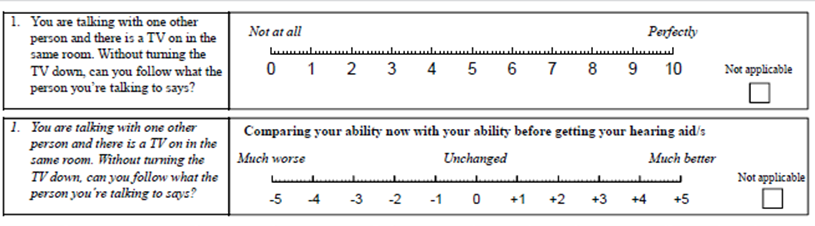
Figure 9-18. Question #1 on the SSQ-12 self-assessment scale. Top panel shows the original SSQ-12, and bottom panel shows how the same scale is used to measure benefit (SSQ-12-B). Note how the two scales differ.
Jensen et al (2009) administered the 49-question version of the SSQ as a benefit scale to 15 first-time hearing aid wearers. The SSQ was re-administered about 12 weeks post-fitting. Average aided benefit for the questions comprising the SSQ-12-B, was approximately a +3.
Vanderbilt Fatigue Scale for Adults (VFS-A-10). Fatigue is a well-known psychosocial consequence of hearing loss. Listening-related fatigue is believed to be debilitating for many individuals with hearing loss, leading to greater levels of stress during communication and it often has a detrimental effect of quality of life (Holman, et al, 2019). In adults with hearing loss, listening-related fatigue is also linked with being less productive at work, more prone to accidents, more socially isolated, and more likely to be depressed (Davis et al 2021). There is also research that suggests fatigue is one of the most widely experienced emotional consequences associated with hearing loss, surpassed only by social overwhelm and frustration (Bennett, et al, 2022).
Recent research suggests hearing aids can reduce listening related fatigue. Holman et al (2021) found that hearing aid use led to a significant reduction in listening-related fatigue. Additionally, they found that social activity levels increased after hearing aid fitting in the intervention group compared to the control group. Given these findings, it would be beneficial for clinicians to have an effective way to assess listening-related fatigue pre- and post-fitting of hearing aids.
The Vanderbilt Fatigue Scale for Adults (VFS-A-10) is a tool designed by Hornsby et al (2023) to measure fatigue levels in adults in a clinical setting. The scale effectively identifies individuals experiencing clinically significant fatigue, as it was reported to have high internal consistency (Cronbach’s alpha > 0.80) and excellent test-retest reliability (ICC > 0.85). It was also determined that the VFS-A-10 correlates with depression and quality of life (Hornsby, et al, 2023), so in a sense, if you can show that hearing aids reduce fatigue and listening effort, there is a good chance you are increasing their overall quality of life and maybe even lowering their risk of experiencing depression.
The VFS-A-10 is illustrated in Figure 9-19. It can be administered before hearing aid use, and then re-administered several weeks later to demonstrate how much amplification might improve listening-related fatigue. According to Hornsby, et al (2023), a score of 26 or higher is an indication of “frequent problems with fatigue” (Hornsby, et al 2023). Taghvaei (2024) collected VFA-A-10 scores on 42 hearing aid wearers, first in the unaided condition and again approximately one month later in the aided condition. The mean aided score of these 42 hearing aid wearers was 13 and their mean aided score was 6.
Since the VFS-A-10 can be administered in two minutes or less, has been validated, and measures a common problem associated with hearing loss, it is a valuable addition to the clinic toolbox. We recommend using the VFS-A-10 in the following ways.
- Have each patient complete it in the reception area prior to their initial appointment. Review the results during the initial appointment.
- Re-administer it about 4 weeks post-fitting to assess aided benefit in listening-related fatigue. As a general rule, the aided score should be about half of the unaided score.
- Even when the overall aided VFS-A-10 score is low, a high score (4) on an individual question can be identified for improvement with hearing aids and are items that can be targeted with additional counseling.
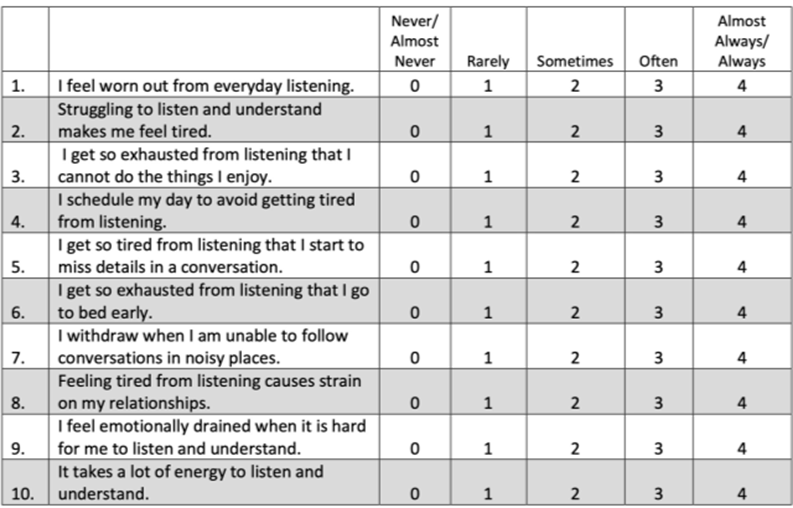
Figure 9-19. The VFS-A-10 (Hornsby et al 2023).
Satisfaction with Amplification in Daily Life (SADL). Most of the inventories that we have talked about to this point relate primarily to assessment of hearing aid benefit. It is useful to have at least one scale with an emphasis on “satisfaction.” While benefit and satisfaction usually are related, this isn’t always true. A satisfaction measure that has been carefully researched is the SADL, as in “Saddle.” This is yet another scale developed by Robin Cox and colleagues (Cox and Alexander, 1999).
As we mentioned earlier, the ECHO and SADL were designed to be pre- and post-fitting matching companions, and therefore, their designs are very similar. The SADL is made up of 15 items—each of the four subscales of the SADL covers a different aspect of satisfaction and was decided upon by interviewing many hearing aid users with at least one year of experience. Like the ECHO, the four subscales are: Positive Effect, Service & Cost, Negative Features, and Personal Image. All items are rated on a 7-category scale: Not at All, A Little, Somewhat, Medium, Considerably, Greatly, and Tremendously. A scoring template is shown in Figure 9-20, with ratings from a sample patient.

Figure 9-20. The scoring template for the SADL (Cox and Alexander, 1999).
International Outcome Inventory for Hearing Aids (IOI-HA). A final self-report scale that we’d like to mention is the IOI-HA (Eye-Oh-Eye-Ha; Cox and Alexander, 2002, Cox et al, 2003). This is one of the more popular scales used today, for some very good reasons, such as: a) it’s short, b) easy to administer, c) easy to score, d) it covers 7 different domains, e) it’s well researched, and f) it’s been translated into 30 or so different languages. The English version is in Figure 9-21. Note that question #8 is not domain related—this question is to determine which of the two scoring templates should be used—the norms are different for patients who report a mild-moderate hearing difficulty vs. those who report a moderate-severe, or severe problem.
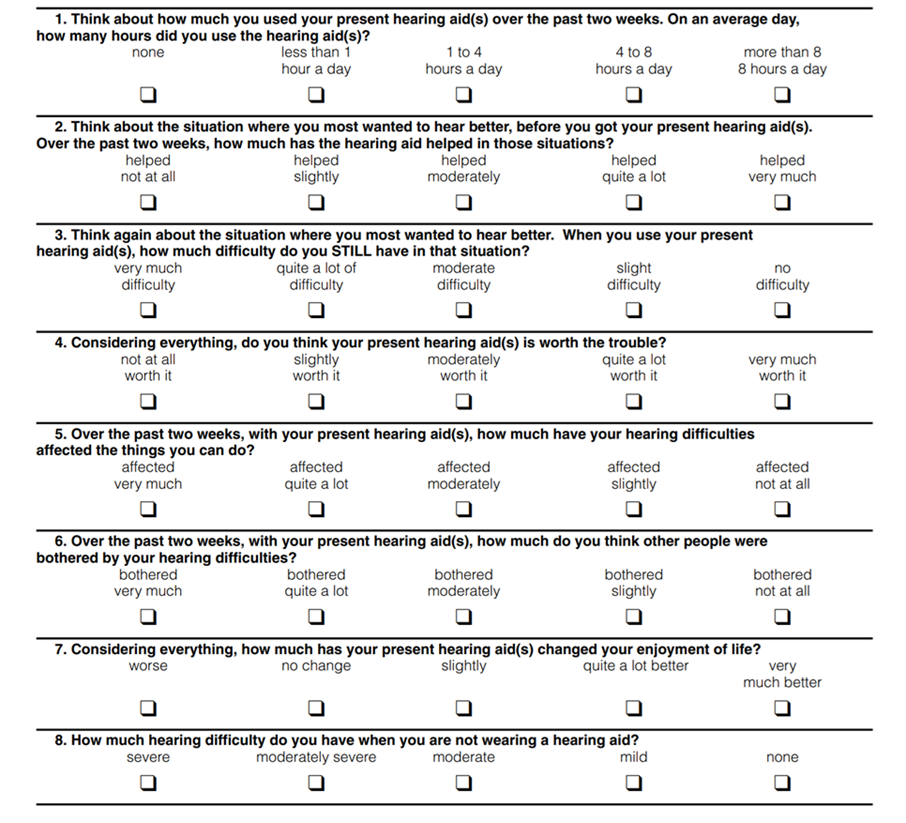
Figure 9-21. The seven questions of the IOI-HA, covering seven different domains. Form includes Question #8, used for determining what normative values are used for interpretation of findings.
Note that each of the first seven questions relate to a different domain. The domains are: Daily use; Benefit; Residual activity limitation; Satisfaction with amplification; Residual participation restriction; Impact of using hearing aids on significant others; and Impact on quality of life.
Each of the seven IOI-HA items has five answers that range from the worst outcome on the left to the best outcome on the right. Answer choices are equidistant in meaning in English. To score the outcome, each answer is given a number value 1 (worst) through 5 (best). The inventory was designed to be given in paper-and-pencil form, but is included in the HIMSA Noah Questionnaire Module, which is a convenient method to store the results.
While having several questions addressing a single domain has its psychometric advantages, the IOI-HA—one question for each domain—can be used as a very quick way to evaluate patient outcomes to reinforce the positive impact of our clinical services, or identify areas that require post-fitting attention—either through device changes, programming adjustments, or counseling. Additionally, the IOI-HA can be useful for clinical comparisons across groups based on differences in clinical setting, treatment options, or specific HCPs. The standard scoring template for a single patient is shown in Figure 9-22. This template is for those who report mild or moderate hearing problems without amplification (based on the answer to Question #8); there is a different template for the patients who report moderate-severe or severe subjective problems.
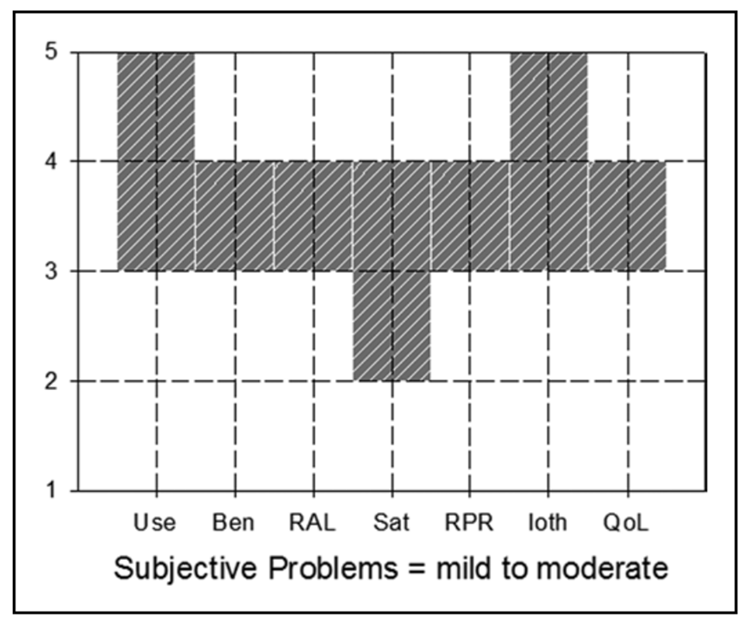
Figure 9-22. IOI-HA scoring template for patients with reported mild-to-moderate hearing loss.
While the template has a shaded “block,” we’re normally just looking at the extremes of the shaded area. Let’s take Benefit for example (“Ben” on the X-axis). The patient would be “within norms” if he or she gave you a “3” or “4” rating. Since there is only one question for each domain, you will never have a score such as 3.5, or 2.5, unless you’re averaging multiple tests from the same person, or doing some averages for a group of your patients.
The template was designed for minimal “clinician burden” for a single patient. If you want to obtain a little more detail, or are looking at averaged data (from several patients or providers), you might want to look at the actual normative means and standard deviations (see https://harlmemphis.org/wp-content/uploads/2020/06/5.pdf). For example, going back to the Benefit rating for patients who report mild-to-moderate problems, the mean for this domain is 3.39, with a standard deviation of .98; this would give you a range of 2.41 to 4.37 (Mueller, 2025).
In Closing
After reading section 9.4, it is easy to see that there is an abundance of valid, easy to use self-assessment. Considering there are so many self-assessments options that assess a variety of factors (many scales didn’t make our list), in the next section we turn our attention to choosing the scales that might fit best in your practice.
Volume 9.5 Which Inventories are Right for Your Clinic?
To this point, we’ve identified several self-report scales, that for one reason or another, or maybe several reasons, are suitable to adopt as a routine clinic measure. BUT . . . we do need to be practical. We’ve talked about clinician burden and patient burden for a given test, but the same issues apply to conducting self-report inventories in general—it probably is only reasonable to routinely use three or four. So, what three or four do you choose?
In this section, we’ll have a friendly discussion regarding what we believe are the advantages and limitations of the various self-assessment scales, and weigh-in on what we would recommend if we were setting up a clinical protocol. Who knows, we might even agree!
Taylor: It seems clear that clinicians should integrate at least a couple of different self-assessment measures into their toolbox. As we mentioned earlier, some of the variables that need to be considered are:
- Scientific rigor. Self-reports that have been shown to be valid, with good test-retest reliability in middle-aged to older adults, assuming that is the population you are most likely to be seeing in the clinic
- Easy to use and brief. Self-reports that can be completed in under 5 minutes with questions that are easily comprehended by most patients.
- Practical and versatile. They measure the most common challenges or problems that most of your patients encounter, and they assess several different dimensions of outcome.
Mueller: I agree with your selection criteria. If you look at surveys on the topic, the two main reasons why self-assessment reports aren’t used more frequently is a) “I don’t have the time” and b) “I don’t see that the findings really change what I do.” So . . . we need to find some scales with low burden, but those that also “pack a punch.”
Taylor: For starters, I think it’s important to include one that helps assess the hearing problem—a supplement to the pure-tone audiogram. As we mentioned earlier, some individuals self-report hearing difficulties despite a normal audiogram (over-estimaters = patients who self-rate their hearing difficulty is worse than their audiogram), while others do not perceive hearing difficulties even though they might have a significant loss on the audiogram (under-estimaters = patients who self-report their hearing difficulty is better than their audiogram).
For example, we know that middle-aged and younger individuals commonly overestimate hearing difficulties relative to the hearing thresholds on the audiogram (Kamil, et al, 2015). In some of these cases of overestimation, it is possible these individuals might be experiencing a real perceptual deficit that the routine hearing test is not detecting, such as cochlear synaptic loss or a central auditory processing deficit. We referred to these deficits as “hidden hearing loss” in Volume 9.2.
Interestingly, the problem of over-estimating hearing loss is not confined to younger patients. Older adults exposed to negative aging stereotypes rated their hearing worse than what the audiogram suggested (Barber and Lee, 2015). However, another study indicates that older adults tend to underestimate their hearing loss because it progresses so slowly that they become unaware of the changes (Ramage-Morin et al 2019). For these reasons, it’s a good idea to include a self-assessment of a person’s own perception of his or her hearing difficulties.
So, Gus, if you had to choose one self-assessment that, say, identifies communication problems in people with normal audiograms, which one would you choose?
Mueller: I’d have to go with the time-honored RHHI (HHIE/HHIA). It clearly meets our criteria of low patient and clinician burden, and having 40+ years of background research certainly helps. I like the psychosocial aspect of the questions, rather than focusing on a specific domain, such as understanding speech in background noise.
Taylor: You can’t go wrong with the RHHI, but a different one to consider, especially if you are working in a multispecialty medical practice and are doing hearing screenings on younger and middle-aged adults, is the THS-H. Granted, it doesn’t have the scientific rigor of the RHHI, but it’s just four questions that could be asked before the hearing screening that identify individuals with significant communication problems that have normal audiograms. Also, because some people overestimate, while others underestimate, I also like to ask patients “Solodar’s One Question” (SOQ), which we discussed earlier. It’s an easy way to quickly determine how an individual perceives their problem. It’s especially valuable during a hearing aid evaluation appointment.
Mueller: HA! We’re already up to three scales and we’re just getting started. But here is a thought . . . you could combine the RHHI, the THS-H and the SOQ on one form, and collect all that information in one fell swoop! You’d still only have 15 low-burden questions—you really don’t have to tell the patient that you did three different scales! It’s also important to point out, that the RHHI will be used as a measure of benefit, so having these unaided results are going to very useful down the road. So maybe next we should talk about inventories that might assist in determining hearing aid candidacy, although we already have the SOQ. Do we need another?
Taylor: Maybe. We mentioned abbreviated versions of the COAT and the HAFIE and also discussed the ECHO. Although the ECHO has scientific rigor and measures several important dimensions of hearing aid use, I find it’s too long and cumbersome to use in a typical clinical setting.
Mueller: Recall that the ECHO was designed to be used in partnership with the SADL, so there is also that to consider. Do we have a space on our dance card to add the SADL?
Taylor: Good point. Consider that in this category we also have the abbreviated versions of the COAT and the HAFIE. I could see either of these being valuable additions to determining hearing aid candidacy. Considering that the HAFIE has a section devoted to wireless streaming and apps, features that are available on all modern hearing aids, and the HAFIE has a section that assesses patient preferences for them, it gets my vote.
Mueller: Recall our task here is to end up with no more than 3 or 4 inventories. I see the value in the HAFIE, but I think it would be pretty easy during the case history to obtain the necessary information gathered from either the ACOAT the HAFIE. I don’t think it’s worth giving up one of my limited choices, so I’m going to pass. I’m looking for inventories with more “bang-for-the-buck.”
Taylor: Let’s move on to self-assessments that can be conducted before and after the hearing aid fitting – ones that measure benefit and/or satisfaction. Although the APHAB has a lot of data behind it, it’s a no-go for me in the clinic because it’s too long. In my experience the APHAB also tends to have several questions on it that don’t pertain to the individual I am fitting with hearing aids. Here is an example of what I mean…. Not too many patients answer this APHAB question: “I miss a lot of information when I’m listening to a lecture.” I’ve found that about 20% of the questions don’t pertain to the daily experiences of the individual, so the APHAB slows me down in the clinic.
Mueller: There are several tips for scoring when the patient only answers a few of the questions, and recall that we have automated scoring available, but . . . I’m going to agree with you. Is a great scale if you’re going to do a little clinical research project, but for everyday use, probably not. That saves room on our list for selecting the COSI, which would pretty much be everyone’s first choice I suspect.
Taylor: You’re right, because it can be customized to the individual, the COSI is definitely my “go-to” benefit measure in the clinic. As we discussed, the COSI allows you to hone-in on the situations most meaningful to the individual. And when the PEW is added to the COSI, it adds another level of person-centered care – something all of us need to be doing these days.
Another thing I like about the COSI is that, like they say about the U.S. Constitution, it’s a “living and breathing” document.
Mueller: Living and breathing?
Taylor: Because it can be modified or amended. Unlike the U.S. Constitution, which hasn’t been amended since 1992, the COSI can be easily “amended” at any appointment. If targeted goals change, simply modify the COSI. In fact, I think clinicians should re-visit the goals on the COSI at just about every appointment as well as modify self-reported outcomes on the COSI’s 1 to 5 scale.
Mueller: Right, as we discussed earlier many patients only have two everyday listening situations that are pretty constant, and the others vary in importance, and also change over time. But we do have a problem here . . . by adding the COSI and PEW, you (we) are now up to 5 scales, and I don’t think we’ve even covered all the domains.
Taylor: Well . . . now that you bring that up, I do want to add another newer outcome measure that I really like: the VFS-A-10, which assesses listening-related fatigue and how it might affect socializing and quality of life. I think it’s a great complement as a benefit measure to the COSI for this reason . . . In my experience, the goals that are listed on the COSI are usually related to understanding speech in noisy places, following conversations, or hearing soft speech. For good reason, those targeted goals are a focal point of follow-up care. By adding the VFS-A-10 to your toolbox, and having the patient self-assess these issues related to fatigue, you can easily uncover some other areas of concern that can be targeted with hearing aids. I find it to be an effective way to broaden the conversation with patients about ways hearing aids can help in daily life, and you can demonstrate when the VFS-A-10 is conducted in the aided condition that hearing aids improve problems like fatigue and feeling emotionally drained at the end of the day.
Mueller: Well, I suspect Ben Hornsby (who developed the VSF-A-10), is never going to read this, but if he does, sorry Ben, but I just don’t see this as part of a clinician’s 3 or 4-Scale starter kit. I see this as something that one might pull out of your back pocket down the road when a more in-depth counseling procedure is warranted. I like the fact that it’s relatively a different domain, but I just don’t see it making my “Top 3.”
And speaking of Top 3, we have to include the IOI-HA as our final inventory. It bothers me a little that we don’t have a separate scale of satisfaction, but at least with the IOI-HA we have one question for this domain. I’m guessing you’d also pick the IOI-HA?
Taylor: Oh yes, any self-assessment tool that can capture multiple dimensions of outcome in ten questions or less (in the case of the IOI-HA it is 7), is worth adding to your toolbox. If I am already using the RHHI, HAFIE, COSI and VFS-A-10, I don’t really see the need to add the IOI-HA. Although if I am managing multiple practices and my clinics are fitting hearing aids on hundreds of patients every year, the IOI-HA would be an efficient way to assess multiple dimensions of benefit. By comparing the data from your clinic to the IOI-HAs published norms (see Figure 9-22), you could identify areas of improvement for your clinic.
Mueller: I think I’d place a little more individual-patient value in the IOI-HA than you suggest. It touches on domains not included in the other scales you’ve selected. I recognize that it was designed to simply be practically oriented, comprise a mini-profile, and not really be an actual scale. But . . . with that said, let’s face it . . . having one question/answer to domains such as Daily Use, Satisfaction with amplification, Impact of using hearing aids on significant others, and Impact on quality of life, is better than not having any questions/answers at all, which unfortunately is the case in many clinics today.
I think we’ve covered all the areas where self-report measures are typically used in the clinic. So, let’s see if I have our picks correct:
Mueller’s Clinic: RHHI, COSI, and the IOI-HA
Taylor’s Clinic: RHHI, THS-H, HAFIE, COSI/PEW, VFS-A-10, and the IOI-HA.
Taylor: Although I’m over budget on my self-assessments, I’m sticking to my list. When you tally all the questions on the RHHI, THS-H, the streaming and connectivity questions of the HAFIE, VFS-A-10 and the IOI-HA, it’s not that many more than the 24-question APHAB. I think having those extra questions helps me save time because I can quickly scan through the patient’s responses to the questions and target the areas where they scored the lowest. I find that I have more direct conversations with patients when I have their responses to the questionnaires ahead of time. It works better than asking a lot of meandering, open-ended questions, fishing around for problems and concerns. Besides, last time I went to the doctor, I had to fill out a questionnaire that was at least that long. It was easy to do as I waited. You can place all those questions on a single form to make it easy for patients to complete before their appointment. You might even place them on an iPad and make the scoring super easy.
In Closing
So, there you have it. Our thoughts on selection of self-report inventories for routine clinical use. The beauty is those of you reading this have the opportunity to take the background data we’ve provided and select your own protocol. Fitting these self-report scales into a daily routine is not as difficult as you might think. Some of you might want to start with only one or two, others might want to try out the “Mueller Three,” or jump in headfirst with the “Taylor Seven.” Regardless, good luck!
References
Assef, R., Almeida, K., & Miranda-Gonsalez, E. (2022). Sensitivity and specificity of the Speech, Spatial and Qualities of Hearing Scale (SSQ5) for screening hearing in adults. Codas, 34(4). https://doi.org/10.1590/2317-1782/20212021163
Barber, S. J., & Lee, S. R. (2015). Stereotype threat lowers older adults' self-reported hearing abilities. Gerontology, 62(1), 81–85. https://doi.org/10.1159/000371593
Bennett, R. J., Saulsman, L., Eikelboom, R. H., & Olaithe, M. (2022). Coping with the social challenges and emotional distress associated with hearing loss: A qualitative investigation using Leventhal's self-regulation theory. International Journal of Audiology, 61(5), 353–364. https://doi.org/10.1080/14992027.2021.1958898
Bentler, R. M., Mueller, H. G., & Ricketts, R. A. (2016). Modern hearing aids: Verification, outcome measures and follow-up. Plural Publishing.
Cañete, O. (2022). The 12-item Speech, Spatial and Qualities of Hearing Scale questionnaire: Administration suggestions and guidance. Research Communication. Open Access Peer Reviewed Clinical Protocols.
Cassarly, C., Matthews, L. J., Simpson, A. N., & Dubno, J. R. (2020). The revised Hearing Handicap Inventory and screening tool based on psychometric reevaluation of the Hearing Handicap Inventories for the Elderly and Adults. Ear and Hearing, 41(1), 95–105. https://doi.org/10.1097/AUD.0000000000000741
Cox, R. M. (1997). Administration and application of the APHAB. The Hearing Journal, 50(4), 32–48. https://doi.org/10.1097/01.HJ.0000285674.32484.6f
Cox, R. M., & Alexander, G. C. (1995). The Abbreviated Profile of Hearing Aid Benefit. Ear and Hearing, 16(2), 176–186. https://doi.org/10.1097/00003446-199504000-00005
Cox, R. M. (2005). Choosing a self-report measure for hearing aid outcomes. Seminars in Hearing, 26(3), 149–156. https://doi.org/10.1055/s-2005-922101
Cox, R. M., & Alexander, G. C. (1999). Measuring satisfaction with amplification in daily life: The SADL scale. Ear and Hearing, 20(4), 306–320. https://doi.org/10.1097/00003446-199908000-00004
Cox, R. M., Alexander, G. C., & Gray, G. A. (1999). Personality and the subjective assessment of hearing aids. Journal of the American Academy of Audiology, 10(1), 1–13.
Cox, R. M., & Alexander, G. C. (2000). Expectations about hearing aids and their relationship to fitting outcome. Journal of the American Academy of Audiology, 11(7), 368–407. https://doi.org/10.1097/01.HJ.0000345904.52450.c8
Cox, R. M., & Alexander, G. C. (2002). The International Outcome Inventory for Hearing Aids (IOI-HA): Psychometric properties of the English version. International Journal of Audiology, 41(1), 31–35. https://doi.org/10.3109/14992020209101309
Cox, R. M., Alexander, G. C., & Beyer, C. M. (2003). Norms for the International Outcome Inventory for Hearing Aids. Journal of the American Academy of Audiology, 14(8), 407–417. https://doi.org/10.3766/jaaa.14.8.4
Davis, H., Schlundt, D., Bonnet, K., Camaraa, S., Bess, F. H., & Hornsby, B. W. (2021). Understanding listening-related fatigue: Perspectives of adults with hearing loss. International Journal of Audiology, 60, 458–468. https://doi.org/10.1080/14992027.2020.1848955
Demeester, K., Topsakal, V., Hendrickx, J. J., Fransen, E., van Laer, L., Van Camp, G., Van de Heyning, P., & van Wieringen, A. (2012). Hearing disability measured by the Speech, Spatial, and Qualities of Hearing Scale in clinically normal-hearing and hearing-impaired middle-aged persons, and disability screening by means of a reduced SSQ (the SSQ5). Ear and Hearing, 33(5), 615–616. https://doi.org/10.1097/AUD.0b013e31824f26e9
Dillon, H., James, A., & Ginis, J. (1997). Client Oriented Scale of Improvement (COSI) and its relationship to several other measures of benefit and satisfaction provided by hearing aids. Journal of the American Academy of Audiology, 8(1), 27–43.
Fitzgerald, M., Ward, K., Gianakas, S., Smith, M., Blevins, N., & Swanson, A. (2024). Speech-in-noise assessment in the routine audiologic test battery: Relationship to perceived auditory disability. Ear & Hearing, 45(4), 816–826. https://doi.org/10.1097/AUD.0000000000001343
Garstecki, D., & Erler, S. (1998). Hearing loss, control, and demographic factors influencing hearing aid use among older adults. Journal of Speech, Language, and Hearing Research, 41(3), 527–537. https://doi.org/10.1044/jslhr.4103.527
Gatehouse, S. (1994). Components and determinants of hearing aid benefit. Ear and Hearing, 15(1), 30–49. https://doi.org/10.1097/00003446-199402000-00004
Gatehouse, S., & Noble, W. (2004). The Speech, Spatial and Qualities of Hearing Scale (SSQ). International Journal of Audiology, 43(2), 85–99. https://doi.org/10.1080/14992020400050014
Gates, G. A., Murphy, M., Rees, T., & Fraher, A. (2003). Screening for handicapping hearing loss in the elderly. Journal of Family Practice, 52(1), 56–62.
Holman, J. A., Drummond, A., Hughes, S. E., & Naylor, G. (2019). Hearing impairment and daily-life fatigue: A qualitative study. International Journal of Audiology, 58, 408–416. https://doi.org/10.1080/14992027.2019.1572105
Holman, J. A., Drummond, A., & Naylor, G. (2021). Hearing aids reduce daily-life fatigue and increase social activity: A longitudinal study. Trends in Hearing, 25, 23312165211052786. https://doi.org/10.1177/23312165211052786
Hornsby, B. W. Y., Camarata, S., Cho, S. J., Davis, H., McGarrigle, R., & Bess, F. H. (2023). Development and validation of a brief version of the Vanderbilt Fatigue Scale for Adults: The VFS-A-10. Ear and Hearing, 44(5), 1251–1261. https://doi.org/10.1097/AUD.0000000000001378
Humes, L. E. (2022). Assessing auditory wellness in older adults. AudiologyOnline, Article 28087. Retrieved from https://www.audiologyonline.com
Jacobson, G. P., Newman, C. W., Fabry, D. A., & Sandridge, S. A. (2001). Development of the Three-Clinic Hearing Aid Selection Profile (HASP). Journal of the American Academy of Audiology, 12, 128–141. https://doi.org/10.1055/s-0040-1715960
Jensen, N., Akeroyd, M., Noble, W., & Naylor, G. (2009). The Speech, Spatial and Qualities of Hearing Scale (SSQ) as a benefit measure. Paper presented at the NCRAR Conference: The Ear-Brain System: Approaches to the Study and Treatment of Hearing Loss.
Kamil, R. J., Genther, D. J., & Lin, F. R. (2015). Factors associated with the accuracy of subjective assessments of hearing impairment. Ear and Hearing, 36(1), 164–167. https://doi.org/10.1097/AUD.0000000000000091
Kochkin, S. (1997). MarkeTrak IV: What is the viable market for hearing aids? Hearing Journal, 50(1), 31–38.
Lichtenstein, M., Bess, F., & Logan, S. (1988). Validation of screening tools for identifying hearing-impaired elderly in primary care. Journal of the American Medical Association, 259(19), 2875–2878. https://doi.org/10.1001/jama.1988.03720190051032
Mealings, K., Valderrama, J., Mejia, J., Yeend, I., Beach, E., & Edwards, B. (2024). Hearing aids reduce self-perceived difficulties in noise for listeners with normal audiograms. Ear and Hearing, 45(1), 151–163. https://doi.org/10.1097/AUD.0000000000001344
Mueller, H. G. (2025). Hearing aid selection and fitting: The role of self-report inventories. AudiologyOnline, Article 29198. Retrieved from https://www.audiologyonline.com
Mueller, H. G., Ricketts, T., & Bentler, R. (2014). Modern hearing aids: Pre-fitting testing and selection considerations. Plural Publishing.
Mueller, H. G., Coverstone, J., Galster, J., Jorgensen, L., & Picou, E. (2021). 20Q: The new hearing aid fitting standard – A roundtable discussion. AudiologyOnline, Article 27938. Retrieved from https://www.audiologyonline.com
Mueller, H. G., Ricketts, T., & Hornsby, B. Y. G. (2023). Speech-in-noise testing – Too useful to be ignored! AudiologyOnline, Article 28760. Retrieved from https://www.audiologyonline.com
Noble, W., Jensen, N. S., Naylor, G., Bhullar, N., & Akeroyd, M. A. (2013). A short form of the Speech, Spatial and Qualities of Hearing scale suitable for clinical use: The SSQ12. International Journal of Audiology, 52(6), 409–412. https://doi.org/10.3109/14992027.2013.781278
Palmer, C. V., & Mormer, E. (1999). Goals and expectations of the hearing aid fitting. Trends in Amplification, 4(2), 61–71. https://doi.org/10.1177/108471389900400203
Palmer, C. V., Solodar, H., Hurley, W., Byrne, D., & Williams, K. (2009). Self-perception of hearing ability as a strong predictor of hearing aid purchase. Journal of the American Academy of Audiology, 20(6), 341–347. https://doi.org/10.3766/jaaa.20.6.4
Ramage-Morin, P. L., Banks, R., Pineault, D., & Atrach, M. (2019). Unperceived hearing loss among Canadians aged 40 to 79. Health Reports, 30(8), 11–20. https://doi.org/10.25318/82-003-x201900800002-eng
Ricketts, T., Bentler, R., & Mueller, H. G. (2019). Essentials of modern hearing aids. Plural Publishing.
Roup, C., Post, E., & Lewis, J. (2018). Mild-gain hearing aids as a treatment for adults with self-reported hearing difficulties. Journal of the American Academy of Audiology, 29(6), 477–494. https://doi.org/10.3766/jaaa.16134
Saleh, H. K., Folkeard, P., Liao, S., & Scollie, S. (2024). Development and initial evaluation of the Hearing Aid Attribute and Feature Importance Evaluation (HAFIE) questionnaire. International Journal of Audiology, 63(9), 712–721. https://doi.org/10.1080/14992027.2024.2312229
Sandridge, S., & Newman, C. (2006). Improving the efficiency and accountability of the hearing aid selection process: Use of the COAT. AudiologyOnline. Retrieved from https://www.audiologyonline.com
Saunders, G., Chisolm, T., & Abrams, H. (2005). Measuring hearing aid outcomes—Not as easy as it seems. Journal of Rehabilitation Research and Development, 42(4 Suppl 2), 157–168. https://doi.org/10.1682/JRRD.2005.01.0017
Schum, D. (1999). Perceived hearing aid benefit in relation to perceived needs. Journal of the American Academy of Audiology, 10(1), 40–45.
Sherlock, L., Ellis, G., Davidson, A., & Brungart, D. (2024). Rapid assessment of tinnitus complaints with a modified version of the Tinnitus and Hearing Survey. Trends in Hearing, 28, 23312165241242235. https://doi.org/10.1177/23312165241242235
Simpson, A. N., Matthews, L. J., Cassarly, C., & Dubno, J. R. (2019). Time from hearing aid candidacy to hearing aid adoption: A longitudinal cohort study. Ear and Hearing, 40(3), 468–476. https://doi.org/10.1097/AUD.0000000000000641
Sindhusake, D., Mitchell, P., Smith, W., Golding, M., Newall, P., Hartley, D., & Rubin, G. (2001). Validation of self-reported hearing loss: The Blue Mountains Hearing Study. International Journal of Epidemiology, 30(6), 1371–1378. https://doi.org/10.1093/ije/30.6.1371
Aghvaei, N. (2024). Clinical application of the Vanderbilt Fatigue Scale for Adults (VFS-A-10): Feasibility and ease of use in a dispensing practice. Poster presented at the annual American Academy of Audiology Meeting, Atlanta, GA.
Taylor, B., & Mueller, H. G. (2023). Research QuickTakes Volume 1: Understanding and treating the background noise problem for hearing aid users. AudiologyOnline, Article 28674. Retrieved from https://www.audiologyonline.com
Taylor, B., & Mueller, H. G. (2024). Research QuickTakes Volume 8: Hearing aid fitting toolbox v2 – Non-audiologic considerations in the selection and fitting of hearing aids. AudiologyOnline, Article 29093. Retrieved from https://www.audiologyonline.com
Weinstein, B. (1997). Outcome measures in the hearing aid fitting/selection process. Trends in Hearing, 2(4), 117–127. https://doi.org/10.1177/2331216516643280
Weycker, J., Dillard, L., Pinto, A., Fischer, M., Cruickshanks, K., & Tweed, T. (2021). Factors affecting hearing aid adoption by adults with high-frequency hearing loss: The Beaver Dam Offspring Study. American Journal of Audiology, 30(4), 1067–1075. https://doi.org/10.1044/2021_AJA-21-00109
Wiley, T., Cruickshanks, K., Nondahl, D., & Tweed, T. (2000). Self-reported hearing handicap and audiometric measures in older adults. Journal of the American Academy of Audiology, 11(2), 67–75. https://doi.org/10.1055/s-0040-1715972
World Health Organization. (2001). International classification of functioning, disability and health. Geneva: World Health Organization.
Citation
Taylor, B. & Mueller, H. G. (2025). Research QuickTakes Volume 9: Clinical implementation of self-assessment inventories. AudiologyOnline, Article 29289. Retrieved from https://www.audiologyonline.com